
Mathematics, 10.12.2020 22:40 spookymod4845
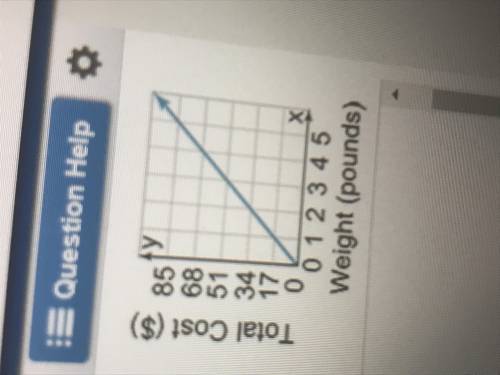
The graph shows the relationship between the weight of silver and the total cost. Which of the following is true?
A. The graph shows a proportional relationship.
B. The point (2,34) means that 34 pounds of silver cost $2.00 per pound.
C. The point (1,17) shows the constant of proportionality.
D. The point (0,0) means that 0 pounds of silver cost $0.00.
E. The point (4,68) means that $4.00 is the cost for 68 pounds of silver.

Answers: 3


Another question on Mathematics
Mathematics, 21.06.2019 19:30
Acollection of coins has value of 64 cents. there are two more nickels than dimes and three times as many pennies as dimes in this collection. how many of each kind of coin are in the collection?
Answers: 1
Mathematics, 21.06.2019 19:30
If the ratio of sum of the first m and n terms of an ap is m2 : n2 , show that the ratio of its mth and nth terms is (2m − 1) : (2n − 1).
Answers: 1
Mathematics, 21.06.2019 20:00
Worth 30 points! in this diagram, both polygons are regular. what is the value, in degrees, of the sum of the measures of angles abc and abd?
Answers: 2
Mathematics, 21.06.2019 23:00
Solve the problem by making up an equation. a man could arrive on time for an appointment if he drove the car at 40 mph; however, since he left the house 15 minutes late, he drove the car at 50 mph and arrive 3 minutes early for the appointment. how far from his house was his appointment?
Answers: 1
You know the right answer?
The graph shows the relationship between the weight of silver and the total cost. Which of the follo...
Questions

Biology, 06.01.2020 21:31


Social Studies, 06.01.2020 21:31

English, 06.01.2020 21:31
Social Studies, 06.01.2020 21:31
Biology, 06.01.2020 21:31


History, 06.01.2020 21:31


