
Mathematics, 10.12.2020 14:00 anitadefrances
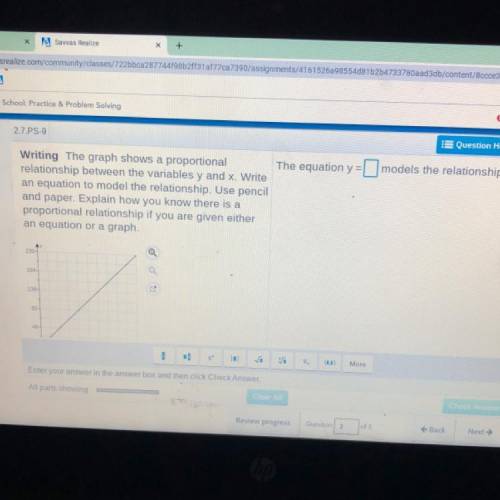
Writing The graph shows a proportional The equation y=models the relationship.
relationship between the variables y and x. Write
an equation to model the relationship. Use pencil
and paper. Explain how you know there is a
proportional relationship if you are given either
an equation or a graph.
A
230-
a
1840
138
92
46
.
(0,0)
More

Answers: 1


Another question on Mathematics
Mathematics, 21.06.2019 19:10
1jessica's home town is a mid-sized city experiencing a decline in population. the following graph models the estimated population if the decline continues at the same rate. select the most appropriate unit for the measure of time that the graph represents. a. years b. hours c. days d. weeks
Answers: 2
Mathematics, 22.06.2019 03:40
What is the following sum in simplest form? square root 8 + 3 square root 2 + square root 32
Answers: 1
Mathematics, 22.06.2019 04:20
What is the difference between a linear interval and a nonlinear interval?
Answers: 1
Mathematics, 22.06.2019 06:00
What is the product of (4x + - 5)? a) -8x^2 - 26x - 15 b) -8x^2 + 26x - 15 c) -8x^2 - 26x + 15
Answers: 1
You know the right answer?
Writing The graph shows a proportional The equation y=models the relationship.
relationship between...
Questions

Mathematics, 21.10.2020 16:01


English, 21.10.2020 16:01

Biology, 21.10.2020 16:01


Computers and Technology, 21.10.2020 16:01
English, 21.10.2020 16:01


