
Mathematics, 10.12.2020 01:00 keegan5096
20 POINTS!
Jared is an intern at a real estate broker’s office. He was asked to record data on the difference of the number of sales made each month by the whole team of realtors and the average number of sales made by similar broker’s offices.
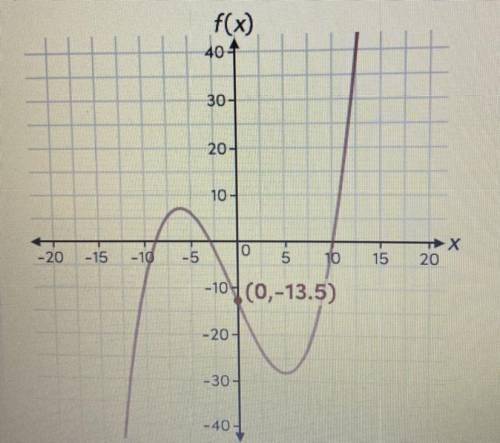
After gathering the current year’s data, Jared decided to include the previous year’s data as well. Using all of the data, he created this function
to model the team’s sales, where X is the number of months since January, when Jared began gathering data, and f(x) is the number of sales as compared with the average. (Shown in picture)
1.) Use the graph to interpret and match the approximate intervals with their descriptions. Drag the tiles to the correct boxes. Not all tiles will be used.
Tiles: (-6.3, 10), (-3, 10), (-9, 0), (4.9, 10), (0, 4.9), (-9, -3)
Pairs:
interval over which the difference of the numbers of the sales is increasing =
interval over which the difference of the numbers of sales is negative =
interval over which the difference of the numbers of sales is increasing =
interval over which the difference of the numbers of sales is positive =
2.) Use graph to complete the statements. Select the correct answer from the drop-down menu.
The team’s total number of sales is equal to the average number of sales at BLANK months from when Jared began gathering data
options: -6.3 and 5; -9, -3, and 10; 3, 9, and 10; -13.5
The team’s minimum number is sales this year occurred at approximately BLANK months from when Jared began gathering data.
options: 7; -6; 5; 0; -28
3.) What are the factors of the equation representing Jared’s function? Select all that apply.
(x-10)
(x-9)
(x+10)
(x+3)
(x+9)
(x-3)
4.) Use the factors of the function and the y-intercept to find the standard form of the equation representing Jared’s function. Type the correct answer in the box.
5.) Jared also gathered data from a competing real estate broker’s office. The competitor’s sales were equal to the average number of sales 8 months before Jared begun gathering data and again 2 and 6 months after he began gathering data. The relative minimum number of sales was lower than the relative minimum number of sales of Jared’s office.
Use the sliders for a, b, c, and d to create a graph that could model the competitor’s number of sales

Answers: 1


Another question on Mathematics
Mathematics, 21.06.2019 14:50
An assembly consists of two mechanical components. suppose that the probabilities that the first and second components meet specifications are 0.87 and 0.84. assume that the components are independent. determine the probability mass function of the number of components in the assembly that meet specifications. x
Answers: 1
Mathematics, 21.06.2019 17:00
Jasmine wants to eat at 8: 00pm her meal takes 65mins to cook what time does she need to put the meal in the oven
Answers: 2
Mathematics, 21.06.2019 23:30
Ateacher wanted to buy a chair, a bookshelf, two tables and a desk. she spent $900 for all five items and the chair and the desk combined 70% of her total. if the bookshelf cost $50, how much did each of the tables cost?
Answers: 1
You know the right answer?
20 POINTS!
Jared is an intern at a real estate broker’s office. He was asked to record data on the...
Questions


History, 12.07.2019 01:50
History, 12.07.2019 01:50
Mathematics, 12.07.2019 01:50
Mathematics, 12.07.2019 01:50
Mathematics, 12.07.2019 01:50
Mathematics, 12.07.2019 01:50
Mathematics, 12.07.2019 01:50


History, 12.07.2019 01:50

Mathematics, 12.07.2019 01:50
History, 12.07.2019 01:50


