Mathematics, 10.12.2020 01:00 Mrdwarf7163
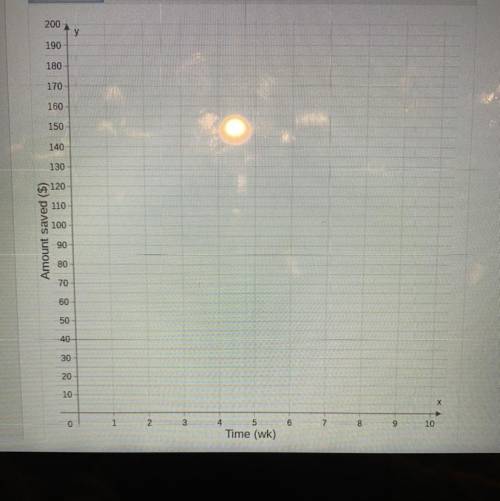
Caleb needs S120 to pay for tickets to an amusement park. He has S75 already and saves $5 a week.
Use the Segment tool to plot a graph representing the amount of money Caleb has saved from the time he begins saving until he has
saved enough for the tickets.
Pls help do the graph!!


Answers: 1


Another question on Mathematics

Mathematics, 21.06.2019 13:00
Aright triangle includes one angle that measures 30º. what is the measure of the third angle? a. 30º b. 90º c. 60º d. 130º
Answers: 2


Mathematics, 21.06.2019 21:50
The value of the expression 16-^3/4 8 1/8 -6 6 1/40 1/64
Answers: 1

Mathematics, 22.06.2019 02:00
Pleasseee important quick note: enter your answer and show all the steps that you use to solve this problem in the space provided. use the circle graph shown below to answer the question. a pie chart labeled favorite sports to watch is divided into three portions. football represents 42 percent, baseball represents 33 percent, and soccer represents 25 percent. if 210 people said football was their favorite sport to watch, how many people were surveyed?
Answers: 1
You know the right answer?
Caleb needs S120 to pay for tickets to an amusement park. He has S75 already and saves $5 a week.
U...
Questions


Mathematics, 17.04.2021 23:50

Engineering, 17.04.2021 23:50

English, 17.04.2021 23:50

History, 17.04.2021 23:50


Computers and Technology, 17.04.2021 23:50


Mathematics, 17.04.2021 23:50

Mathematics, 17.04.2021 23:50


Mathematics, 17.04.2021 23:50

Social Studies, 17.04.2021 23:50

Mathematics, 17.04.2021 23:50


Mathematics, 17.04.2021 23:50

 =
=


