
Mathematics, 04.12.2020 02:40 auviannadority13
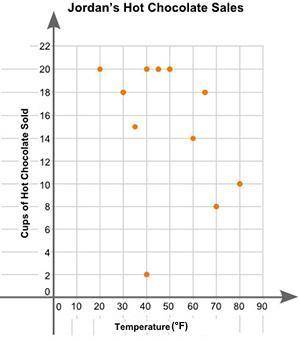
Jordan plotted the graph below to show the relationship between the temperature of his city and the number of cups of hot chocolate he sold daily (shown in the picture) Describe how you can make the line of best fit. Write the approximate slope and y-intercept of the line of best fit. Show your work, including the points that you use to calculate the slope and y-intercept.

Answers: 2


Another question on Mathematics
Mathematics, 21.06.2019 23:30
Harry the hook has 7 1/3 pounds of cookie dough.she uses 3/5 of it to bake cookie. how much cookie dough does she use to make cookie?
Answers: 1
Mathematics, 22.06.2019 00:00
The perimeter of a quarter circle is 14.28 miles. what is the quarter circle's radius?
Answers: 1
Mathematics, 22.06.2019 03:30
Ineed asap. 35 points. in order for two polygons to be similar, two conditions must be met. first, all pairs of corresponding sides must be in proportion. second, all corresponding angles must be congruent. prove that angle congruence is not enough, by itself, to establish that two polygons are similar. do this by describing or drawing two polygons that are not similar but whose corresponding angles are all congruent.
Answers: 1
Mathematics, 22.06.2019 04:40
This assignment is past the original due date o this data is from a sample. calculate the mean, standard deviation, and variance 16.7 11.1 46.7 14.8 13.3 16.6 18.5 47.3 42,8 show the following answers to 2 decimal places. sample mean- sample standard deviation ( use the standard deviation above for your calculation.) sample variance ooops- now you discover that the data was actually from a population! so now you must give the population standard deviation.
Answers: 3
You know the right answer?
Jordan plotted the graph below to show the relationship between the temperature of his city and the...
Questions


Social Studies, 08.01.2021 17:50
Mathematics, 08.01.2021 17:50
Mathematics, 08.01.2021 17:50
Mathematics, 08.01.2021 17:50

Biology, 08.01.2021 17:50

English, 08.01.2021 17:50
Mathematics, 08.01.2021 17:50


