
Mathematics, 30.11.2020 18:50 drandbone92
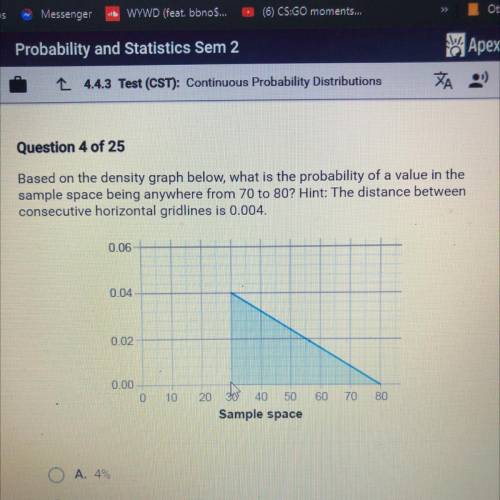
Based on the density graph below, what is the probability of a value in the
sample space being anywhere from 70 to 80? Hint: The distance between
consecutive horizontal gridlines is 0.004.
0.06
0.04
0.02
0.00
0
10
60
70
80
20 30 40 50
Sample space
O A. 4%
O B. 16%
O C. 36%
D. 64%

Answers: 2


Another question on Mathematics
Mathematics, 21.06.2019 15:00
Ateacher has $80 to buy workbooks. each work book cost $3. if she buys as many workbooks as possible, how much money does she have leftover? a) $2 b) $4 c) $6 d) $8
Answers: 1
Mathematics, 21.06.2019 18:30
Deshawn uses 3/4 of a box of rice to cook dinner the portion he uses weighs 12 ounces right and solve an equation to find the weight of the full box of rice
Answers: 1
Mathematics, 21.06.2019 23:30
Drag each equation to the correct location on the table. for each equation, determine the number of solutions and place on the appropriate field in the table.
Answers: 3
You know the right answer?
Based on the density graph below, what is the probability of a value in the
sample space being anyw...
Questions

English, 19.05.2020 14:05

Biology, 19.05.2020 14:05

Physics, 19.05.2020 14:05

Social Studies, 19.05.2020 14:05
Biology, 19.05.2020 14:05
Mathematics, 19.05.2020 14:05
Mathematics, 19.05.2020 14:05
Mathematics, 19.05.2020 14:05
Mathematics, 19.05.2020 14:05
English, 19.05.2020 14:05
Mathematics, 19.05.2020 14:05
Mathematics, 19.05.2020 14:05


