
Mathematics, 25.11.2020 02:00 kyleee1991
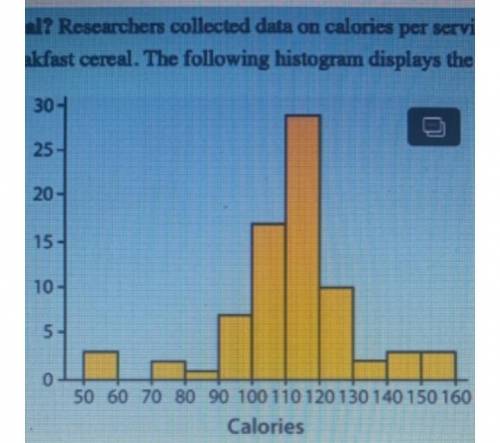
Researchers collected data on calories per serving for 77 brands of breakfast cereal. The histogram displays the data
30
25-
20
1
Frequency
15
What is the approximate center of this distribution?
The center of the distribution is between 120 and 130
calories.
The center of the distribution is between 90 and 100
calories.
The center of the distribution is between 110 and 120
calories.
The center of the distribution is between 80 and
90 calories.
The center of the distribution is between 130 and 140
calories.
10
-
50 60 70 80 90 100 110 120 130 140 150 160
Calories

Answers: 3


Another question on Mathematics
Mathematics, 21.06.2019 16:30
Both the red and blue line segments stretch from the center of the circle to a point on the circle. the length of the blue segment is 5. how long is the red line segment?
Answers: 1
Mathematics, 21.06.2019 21:30
Aculture started with 4,000 bacteria. after 5 hours, it grew to 5,200 bacteria. predict how many bacteria will be present after 19 hours. round your answer to the nearest whole number.
Answers: 1
Mathematics, 21.06.2019 22:00
Simplify (4x^2 - 8xy + 2y^2) - (9x^2 - 4xy - 7y^2) a. -5x^2 + 4xy + 9y^2 b. -5x^2 - 4xy + 9y^2 c. -5x^2 + 12xy + 4y^2 d. -5x^2 - 4xy - 5y^2
Answers: 1
Mathematics, 21.06.2019 22:30
How can constraints be used to model a real-world situation?
Answers: 1
You know the right answer?
Researchers collected data on calories per serving for 77 brands of breakfast cereal. The histogram...
Questions

English, 24.04.2020 04:55
Mathematics, 24.04.2020 04:56
Mathematics, 24.04.2020 04:56
Mathematics, 24.04.2020 04:56

Health, 24.04.2020 04:56
Mathematics, 24.04.2020 04:56

Geography, 24.04.2020 04:56

History, 24.04.2020 04:56
Mathematics, 24.04.2020 04:56

Computers and Technology, 24.04.2020 04:56


Social Studies, 24.04.2020 04:56

Health, 24.04.2020 04:56
Mathematics, 24.04.2020 04:56


