
Mathematics, 24.11.2020 21:40 adjjones2011
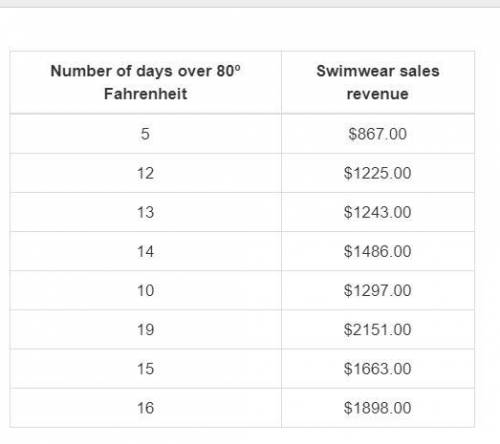
A store manager created this table representing the relationship between the reported days of an outside temperature of over 80º Fahrenheit during a given month, x, and the sales revenue of swimwear, y, rounded to the nearest dollar.
Using the linear best-fit model for the data, what is the predicted sales revenue of swimwear given 25 days of an outside temperature of over 80º Fahrenheit during the month?
$1,622.00
$2,320.00
$2,351.00
$2,578.00

Answers: 1


Another question on Mathematics
Mathematics, 21.06.2019 14:30
What are the relative frequencies, to the nearest hundredth, of the rows of the two-way table? group 1: a 15 b 45 group 2: a 20 b 25
Answers: 3
Mathematics, 21.06.2019 18:30
F(x)=x^3+4 question 6 options: the parent function is shifted up 4 units the parent function is shifted down 4 units the parent function is shifted left 4 units the parent function is shifted right 4 units
Answers: 1
Mathematics, 21.06.2019 21:00
Type the correct answer in each box. use numerals instead of words. if necessary, use / fir the fraction bar(s). the graph represents the piecewise function: h
Answers: 3
Mathematics, 21.06.2019 21:00
Out of $20$ creepy-crawly creatures in a room, $80\%$ are flies and $20\%$ are spiders. if $s\%$ of the total legs belong to spiders, what is $s$?
Answers: 2
You know the right answer?
A store manager created this table representing the relationship between the reported days of an out...
Questions


Mathematics, 25.10.2019 23:43


Computers and Technology, 25.10.2019 23:43
Social Studies, 25.10.2019 23:43


