How does this graph change between point D and point G?
5G
4
3
2
1
-5...

Mathematics, 20.11.2020 20:50 kanajahbunn
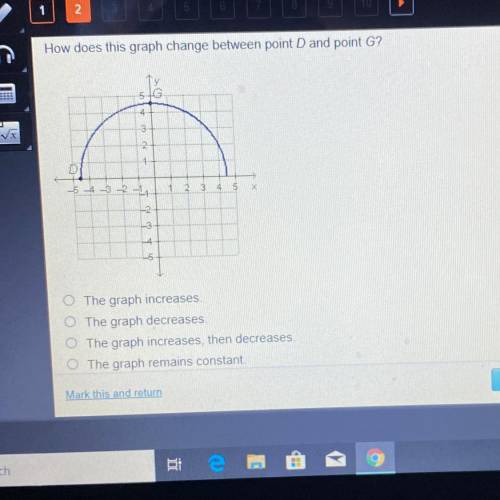
How does this graph change between point D and point G?
5G
4
3
2
1
-5 -3 2-2
5
X
-6
O The graph increases.
O The graph decreases.
O The graph increases, then decreases.
The graph remains constant.

Answers: 2


Another question on Mathematics
Mathematics, 21.06.2019 17:00
What properties allow transformation to be used as a problem solving tool
Answers: 2
Mathematics, 21.06.2019 18:00
Pat listed all the numbers that have 15 as a multiple write the numbers in pats list
Answers: 2
Mathematics, 21.06.2019 19:30
Me max recorded the heights of 500 male humans. he found that the heights were normally distributed around a mean of 177 centimeters. which statements about max’s data must be true? a) the median of max’s data is 250 b) more than half of the data points max recorded were 177 centimeters. c) a data point chosen at random is as likely to be above the mean as it is to be below the mean. d) every height within three standard deviations of the mean is equally likely to be chosen if a data point is selected at random.
Answers: 2
Mathematics, 21.06.2019 21:50
Solve the following pair of equations for x and y: ax/b_ by /a= a +b; ax - by = 2ab
Answers: 2
You know the right answer?
Questions

English, 30.01.2022 19:20
Mathematics, 30.01.2022 19:20

History, 30.01.2022 19:20

Geography, 30.01.2022 19:20

Chemistry, 30.01.2022 19:20
Mathematics, 30.01.2022 19:20


Mathematics, 30.01.2022 19:20
Mathematics, 30.01.2022 19:20
Mathematics, 30.01.2022 19:20
Mathematics, 30.01.2022 19:20


