
Mathematics, 19.11.2020 22:30 herchellann302
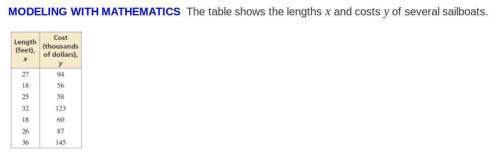
A table listing pairs of values for Length in feet represented by x and Cost in thousands of dollars represented by y. Length, or X values: 27, 18, 25, 32, 18, 26, 36. Cost, or Y values: 94, 56, 58, 123, 60, 87, 145.
a. Use a graphing calculator to find the equation of the line of best fit. Round the slope to the nearest tenth and the y -intercept to the nearest integer.
y= _
b. Identify the correlation coefficient. Round to the nearest thousandth.
r=_
Question 2
Interpret the correlation coefficient.
The data show a _ correlation.
Question 3
c. Interpret the slope and the y -intercept of the line of best fit.
A. The slope, m , means the cost of a sailboat decreases by m thousands of dollars for each foot the length of the sailboat increases. The y -intercept, b , has no meaning because the length of the sailboat cannot be negative.
B. The slope, m , means the cost of a sailboat decreases by m thousands of dollars for each foot the length of the sailboat increases. The y -intercept, b , indicates the smallest length of a sailboat.
C. The slope, m , means the cost of a sailboat increases by m thousands of dollars for each foot the length of the sailboat increases. The y -intercept, b , has no meaning because the cost of the sailboat cannot be negative.
D. The slope, m , means the cost of a sailboat increases by m thousands of dollars for each foot the length of the sailboat increases. The y -intercept, b, indicates the initial cost of the sailboat.
Question 4
d. Use the model from part (a) to approximate the cost of a sailboat that is 20 feet long.
The sailboat costs $_.
e. Use the model from part (a) to predict the length of a sailboat that costs $147,000. Round to the nearest foot.
The length is about _ feet.

Answers: 2


Another question on Mathematics
Mathematics, 21.06.2019 18:30
For this option, you will work individually. the pythagorean theorem can be used in many real-world scenarios. part 1 write your own real-world scenario where the pythagorean theorem can be applied to find a missing piece. you may choose to write a problem that is two- or three-dimensional in nature. be sure that you will be able to draw a diagram of your scenario. write out your problem and submit it for part 1. be sure to end your scenario with a question. part 2 draw a diagram of the scenario you created in part 1. you may draw by hand and scan and upload your drawing or create a computer-generated drawing for submission. be sure to label all parts and dimensions of the drawing. part 3 solve the question that you posed in part 1. show all of your steps in answering the question. for this option, you will need to submit all three parts for full credit—your real-world problem and question, the diagram that you created, and your work solving the problem, showing all steps. * note that your instructor is looking for your own original idea. while it is acceptable to use the internet for research and inspiration, academic integrity policies apply.
Answers: 1
Mathematics, 21.06.2019 20:00
Worth 30 points! in this diagram, both polygons are regular. what is the value, in degrees, of the sum of the measures of angles abc and abd?
Answers: 2
Mathematics, 21.06.2019 21:00
Choose the equation that represents the graph below: (1 point) graph of a line passing through points negative 3 comma 0 and 0 comma 3 y = x − 3 y = −x + 3 y = −x − 3 y = x + 3 will award !
Answers: 3
You know the right answer?
A table listing pairs of values for Length in feet represented by x and Cost in thousands of dollars...
Questions

History, 10.09.2019 05:30
History, 10.09.2019 05:30
Mathematics, 10.09.2019 05:30
Mathematics, 10.09.2019 05:30

World Languages, 10.09.2019 05:30

Mathematics, 10.09.2019 05:30
Mathematics, 10.09.2019 05:30
Mathematics, 10.09.2019 05:30

Computers and Technology, 10.09.2019 05:30

Computers and Technology, 10.09.2019 05:30


