
Mathematics, 17.11.2020 04:40 xxxamslashxxx9
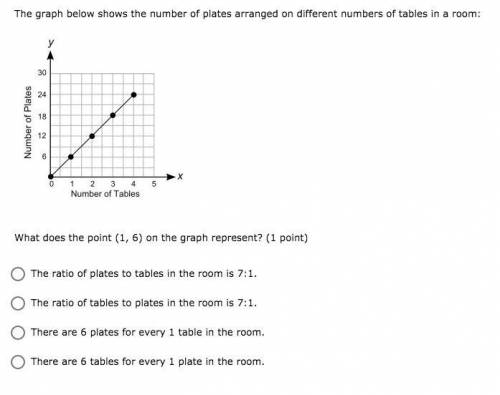
The graph below shows the number of plates arranged on different numbers of tables in a room: A graph is shown. The values on the x-axis are 0, 1, 2, 3, 4, 5. The values on the y-axis are 0, 6, 12, 18, 24, and 30. Points are shown on ordered pairs 0, 0 and 1, 6 and 2, 12 and 3, 18 and 4, 24. These points are connected by a line. The label on the x-axis is Number of Tables. The title on the y-axis is Number of Plates. What does the point (1, 6) on the graph represent? (1 point) The ratio of plates to tables in the room is 7:1. The ratio of tables to plates in the room is 7:1. There are 6 plates for every 1 table in the room. There are 6 tables for every 1 plate in the room.

Answers: 1


Another question on Mathematics
Mathematics, 21.06.2019 14:50
Eight people were asked what the balance of their savings account at the beginning of the month was and how much it increased or decreased by the end of the month. create a scatter plot that represents the data that is shown in the table. the x-axis represents the beginning balance in thousands of dollars and the y-axis represents the change in the savings account in hundreds of dollars. name beginning balance (in thousands of dollars) change in savings account (in hundreds of dollars) jimmy 5 3 kendra 4 7 carlos 5 4 yolanda 3 1 shawn 2 5 laura 3 2 andy 5 6 georgia 4 3
Answers: 1
Mathematics, 21.06.2019 15:40
What is the first quartile of the data set? 10, 11, 12, 15, 17, 19, 22, 24, 29, 33, 38 a. 12 b. 19 c. 29 d. 10
Answers: 1
Mathematics, 21.06.2019 19:00
Billy plotted −3 4 and −1 4 on a number line to determine that −3 4 is smaller than −1 4 .is he correct? explain why or why not
Answers: 3
Mathematics, 21.06.2019 19:30
Cor d? ? me ? max recorded the heights of 500 male humans. he found that the heights were normally distributed around a mean of 177 centimeters. which statements about max’s data must be true? a) the median of max’s data is 250 b) more than half of the data points max recorded were 177 centimeters. c) a data point chosen at random is as likely to be above the mean as it is to be below the mean. d) every height within three standard deviations of the mean is equally likely to be chosen if a data point is selected at random.
Answers: 1
You know the right answer?
The graph below shows the number of plates arranged on different numbers of tables in a room: A grap...
Questions

History, 23.04.2020 16:52

Mathematics, 23.04.2020 16:53


Social Studies, 23.04.2020 16:53
Social Studies, 23.04.2020 16:53
Mathematics, 23.04.2020 16:53

Mathematics, 23.04.2020 16:53
English, 23.04.2020 16:53
Mathematics, 23.04.2020 16:53
Mathematics, 23.04.2020 16:53


