The population of a small town is shown in the table.
Year
1999
2000
2001
2...

Mathematics, 14.11.2020 07:50 wavy419
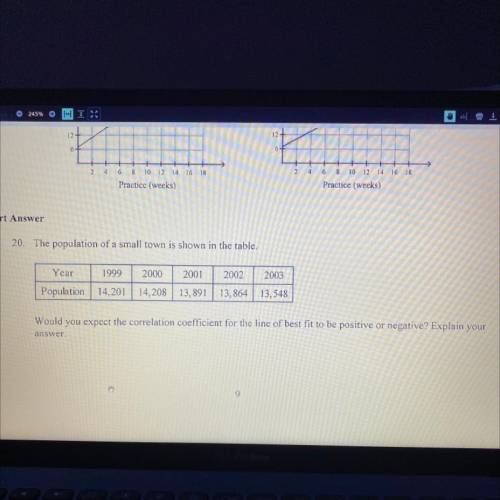
The population of a small town is shown in the table.
Year
1999
2000
2001
2002
2003
Population 14, 201
14,208 13,891
13,864
13,548
Would you expect the correlation coefficient for the line of best fit to be positive or negative? Explain your
answer

Answers: 1


Another question on Mathematics
Mathematics, 21.06.2019 13:30
Lindsay is creating a bridge out of dried pasta and glue. in her plans, she sketches the graph to determine the lengths of the noodles, in centimeters, needed for the arch to increase the length of the bridge in 1 centimeter increments.which function did lindsay use to create her design? f(x) = (x – 5)2 + 8 f(x) = –(x + 5)2 + 8 f(x) = 0.5(x + 5)2 + 8 f(x) = –0.5(x – 5)2 + 8
Answers: 1
Mathematics, 21.06.2019 19:30
Which describes the difference between the graph of f(x)=x^2 and g(x)=-(x^2-2)
Answers: 1
Mathematics, 21.06.2019 21:30
This is a map of the mars exploration rover opportunity predicted landing site on mars. the scale is 1cm : 9.4km. what are the approximate measures of the actual length and width of the ellipse? i mostly need to know how to set it up : )
Answers: 3
You know the right answer?
Questions


Mathematics, 16.04.2020 01:33


Mathematics, 16.04.2020 01:33


