
Mathematics, 13.11.2020 21:50 10040813
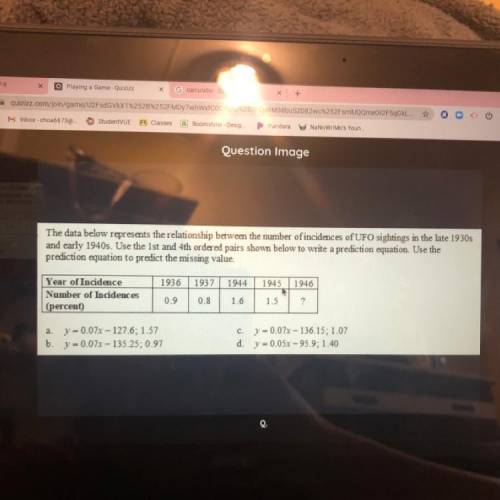
The data below represents the relationship between the mumber of incidences of UFO sightings in the late 1930s
and early 1940s. Use the 1st and 4th ordered pairs shown below to write a prediction equation. Use the
prediction equation to predict the missing value
1936
1937
1944
1945
1946
Year of Incidence
Number of Incidences
(percent)
0.9
0.8
1.6
1.5
?
a
y = 0.07x-127.6: 1.57
y = 0.07x-135.25, 0.97
c. y = 0.07x - 136.15: 1.07
d y = 0.05x - 95.9; 1.40
b.

Answers: 1


Another question on Mathematics
Mathematics, 20.06.2019 18:02
Karl needs to build a stage that has an area of 72 square feet.the length of the stage should be longer than the width.what are the possible whole number measurements for the length and with of the stage complete the table with possible measurements of the stage
Answers: 1
Mathematics, 21.06.2019 15:00
With these: 18/36 = 1/? missing number change 1 5/8 to improper fraction. change 19/5 to a mixed number.
Answers: 1
Mathematics, 21.06.2019 15:30
You have 6 dollars +12 pennies +to quarters + 4 dimes=2 nickels how much do you have
Answers: 1
You know the right answer?
The data below represents the relationship between the mumber of incidences of UFO sightings in the...
Questions


English, 06.06.2020 06:57


Engineering, 06.06.2020 06:58

Computers and Technology, 06.06.2020 06:58
Mathematics, 06.06.2020 06:58
Mathematics, 06.06.2020 06:58


