
Mathematics, 12.11.2020 07:20 Pingkay7111
HELP ASAP!!
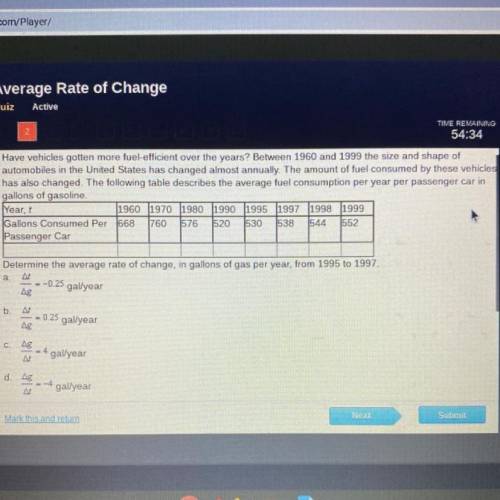
Have vehicles gotten more fuel-efficient over the years? Between 1960 and 1999 the size and shape of
automobiles in the United States has changed almost annually. The amount of fuel consumed by these vehicles
has also changed. The following table describes the average fuel consumption per year per passenger car in
gallons of gasoline.
Year, t
1960 1970 1980 1990 1995 1997 1998 1999
Gallons Consumed Per 668 1760 1576 520 530 1538
1544 1552
Passenger Car
Determine the average rate of change, in gallons of gas per year, from 1995 to 1997.
a. A
--0.25
gal/year
Ag
b. A
-0.25
gal/year
Ag
C
Ag
- 4
gal/year
d.
Ag
--4
gal/year

Answers: 1


Another question on Mathematics
Mathematics, 21.06.2019 12:30
The graph shows the rate at which paint is used to paint a wall.enter values to complete each statement below based on the graph.when 1 gallon of paint has been used, ( # ) square feet of the wall will be painted.the unit rate is ( # )square feet per gallon.
Answers: 2
Mathematics, 21.06.2019 16:30
When only separate discreet points are graphed it is called?
Answers: 3
Mathematics, 21.06.2019 20:30
Drag the tiles to the correct boxes to complete the pairs. not all tiles will be used. match each division expression with the correct quotient.
Answers: 2
You know the right answer?
HELP ASAP!!
Have vehicles gotten more fuel-efficient over the years? Between 1960 and 1999 the size...
Questions

Social Studies, 19.08.2019 08:30


History, 19.08.2019 08:30

Physics, 19.08.2019 08:30
History, 19.08.2019 08:30

Geography, 19.08.2019 08:30
Mathematics, 19.08.2019 08:30
English, 19.08.2019 08:30
Mathematics, 19.08.2019 08:30
Mathematics, 19.08.2019 08:30
Mathematics, 19.08.2019 08:30
Mathematics, 19.08.2019 08:30
History, 19.08.2019 08:30
Mathematics, 19.08.2019 08:30


