
Mathematics, 12.11.2020 02:40 reesewaggoner8
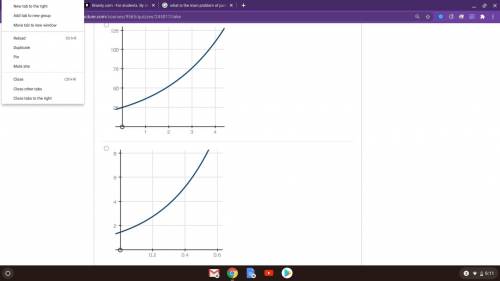
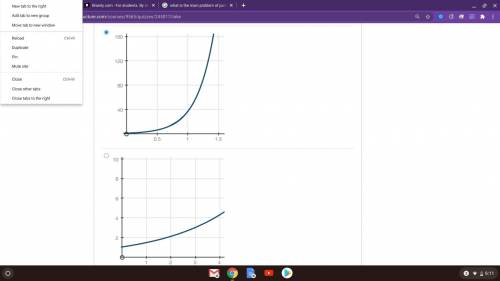
The number of members f(x) in a baseball club increased by 45% every year over a period of x years. The function below shows the relationship between f(x) and x:
f(x) = 25(1.45)x
Which of the following graphs best represents the function?

Answers: 1


Another question on Mathematics
Mathematics, 21.06.2019 17:50
Segment ab is shown on the graph. which shows how to find the x-coordinate of the point that will divide ab into a 2: 3 ratio using the formula
Answers: 2
Mathematics, 21.06.2019 18:00
Use the data on the dot plot to answer the question.how many people read for more than three hours last week? i'm on a unit test review
Answers: 1
Mathematics, 21.06.2019 19:30
Which statements are true? check all that apply. the line x = 0 is perpendicular to the line y = –3. all lines that are parallel to the y-axis are vertical lines. all lines that are perpendicular to the x-axis have a slope of 0. the equation of the line parallel to the x-axis that passes through the point (2, –6) is x = 2. the equation of the line perpendicular to the y-axis that passes through the point (–5, 1) is y = 1.
Answers: 1
You know the right answer?
The number of members f(x) in a baseball club increased by 45% every year over a period of x years....
Questions
Mathematics, 18.11.2020 16:40

Biology, 18.11.2020 16:40
Mathematics, 18.11.2020 16:40

History, 18.11.2020 16:40

English, 18.11.2020 16:40


English, 18.11.2020 16:40

Computers and Technology, 18.11.2020 16:40


