
Mathematics, 09.11.2020 21:50 neptunesx
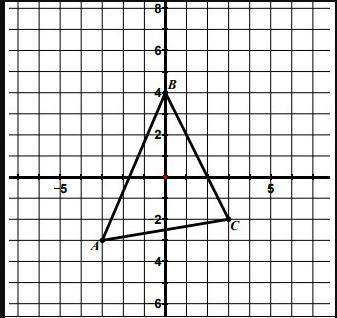
Find the image of the figure below for a dilation with the given center and scale factor r. Draw and label the image.
r = 2
Center of Dilation: origin
Draw your graph on paper, take a picture, and upload it using the image upload icon:
If you do not have the ability to upload an image of your work type "Graph is on paper."

Answers: 2


Another question on Mathematics
Mathematics, 21.06.2019 21:00
Two florida panthers were weighed. one weighs 6x+21 pounds and the two together weigh 14x+11 pounds how much does he other panther weigh alone
Answers: 1
Mathematics, 22.06.2019 01:30
In 2000, for a certain region, 27.1% of incoming college freshman characterized their political views as liberal, 23.1% as moderate, and 49.8% as conservative. for this year, a random sample of 400 incoming college freshman yielded the frequency distribution for political views shown below. a. determine the mode of the data. b. decide whether it would be appropriate to use either the mean or the median as a measure of center. explain your answer. political view frequency liberal 118 moderate 98 conservative 184 a. choose the correct answer below. select all that apply. a. the mode is moderate. b. the mode is liberal. c. the mode is conservative. d. there is no mode.
Answers: 1
Mathematics, 22.06.2019 06:50
Which statement is true about the graphs of the two line y=-8x-5/4 and y=1/8x+4/5
Answers: 1
Mathematics, 22.06.2019 07:50
Assume the population consists of the values 1, 3, 14. assume samples of 2 values are randomly selected with replacement (see page 23 for a definition) from this population. all the samples of n=2 with replacement are 1 and 1, 1 and 3, 1 and 14, 3 and 1, 3 and 3, 3 and 14, 14 and 1, 14 and 3, and 14 and 14. for part a) of this project, find the variance σ2 of the population {1, 3, 14}. for part b) of this project, list the 9 different possible samples of 2 values selected with replacement, then find sample variance s2 (which includes division by n-1) for each of them, and finally find the mean of the sample variances s2. for part c), for each of the 9 different samples of 2 values selected with replacement, find the variance by treating each sample as if it is a population (using the formula for population variance, which includes division by n), then find the mean of those population variances. for part d), which approach results in values that are better estimates of σ2 from part a): part b) or part c)? why? when computing variances of samples, should you use division by n or n-1? upload your answers for a), b), c), and d). the preceding parts show that s2 is an unbiased estimator of σ2. is s and unbiased estimator of σ? the above problem is from triola’s essentials of statistics, 4th edition.
Answers: 2
You know the right answer?
Find the image of the figure below for a dilation with the given center and scale factor r. Draw and...
Questions


History, 16.10.2020 20:01
Mathematics, 16.10.2020 20:01

Biology, 16.10.2020 20:01

Computers and Technology, 16.10.2020 20:01
Mathematics, 16.10.2020 20:01
Biology, 16.10.2020 20:01


