
Mathematics, 08.11.2020 04:00 and7393
Textbook. Use Excel and the GSS 2018 dataset to conduct a Multiple Linear Regression analysis of some of the factors associated with individual income levels. Select any two explanatory independent variables and two control independent variables from the GSS 2018 dataset that you believe would be associated with the dependent variable RINCOM16. Note: If you select a nominal variable as an independent variable, select one with only two valid response categories. The four independent variables you select must meet the requirement for Model Fit - have an F-statistic (reported in the ANOVA Table) that is statistically significant at the 5% level when you run your regression in Excel.
Step 1:
From the GSS Codebook, copy and paste the question associated with each of the variables as well as their response categories and numeric codes. For interval-ratio variables or ordinal variables with many categories, just the range of responses and numeric codes would suffice.
Describe one hypothesis for the expected direction (positive or negative) and strength (weak, moderate or strong) of the relationship between each of the two explanatory independent variables you selected and the dependent variable-RINCOM16 in the US population in 2018. For the purpose of this exercise, your hypotheses need not be be based on theoretical knowledge, just your own knowledge about the possible relationship between each independent variable and the dependent variable. Important: Your hypothesized direction of the relationship must take into account the numeric coding of the response categories for both variables (refer to the GSS Codebook to do so).
Step 2:
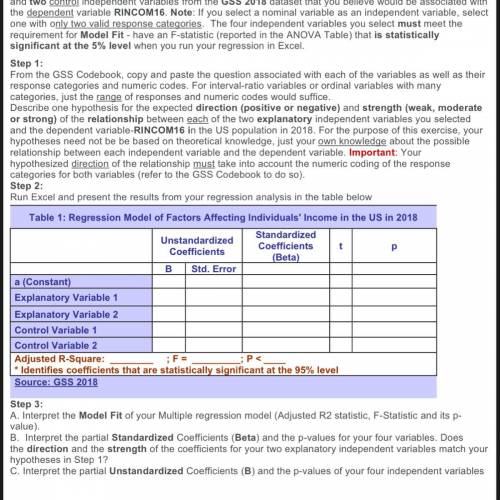
Run Excel and present the results from your regression analysis in the table attached. Step 3:
A. Interpret the Model Fit of your Multiple regression model (Adjusted R2 statistic, F-Statistic and its p-value).
B. Interpret the partial Standardized Coefficients (Beta) and the p-values for your four variables. Does the direction and the strength of the coefficients for your two explanatory independent variables match your hypotheses in Step 1?
C. Interpret the partial Unstandardized Coefficients (B) and the p-values of your four independent variables
Step 4:
For your Multiple Linear Regression model, write down the Least Squares Regression equation reporting your relevant regression coefficients (replace a & b1 through b4 in the equation below with the regression coefficients from Table 1 above:
Y-Predicted = a + b1X1 + b2X2 + b3X3 + b4X4
Using the guidelines provided in the chapter, calculate the predicted score of RINCOM16 for an individual with one hypothetical set of scores or responses for the four independent variables you selected. What would be that individual's predicted income category in $s?

Answers: 2


Another question on Mathematics
Mathematics, 21.06.2019 12:40
An electronics manufacturer wants to know if customers would be interested in a detachable keyboard for their tables and if so, what the most important features would be. the manufacturer partners with an electronics store to include copies of the survey with every purchase at that store for one week. which of the following best explains why this random sample is unlikely to be a good representative sample of tablet owners' preferences for a detachable keyboard? a) one week is likely not enough time to get a large enough sample. b) most people won't bother to send in the survey, which is likely to skew the results c) there is no way to verify whether the responders to the survey actually own a tablet d) the survey is biased because it was conducted through an electronics store, not the general population
Answers: 2
Mathematics, 21.06.2019 16:00
You are cycling around europe with friends. a cycling festival is starting soon in barcelona. it will take 4.5 hours to cycle there. how many minutes in total is this?
Answers: 1
Mathematics, 21.06.2019 17:30
Which of the following is true about the graph of f(x)=7^x. select all that apply. a= it intercepts the x axis b=it intercepts both axis c=it intercepts neither d=it intercepts the y axis
Answers: 1
Mathematics, 21.06.2019 18:00
Name each raycalculation tip: in ray "ab", a is the endpoint of the ray.
Answers: 2
You know the right answer?
Textbook. Use Excel and the GSS 2018 dataset to conduct a Multiple Linear Regression analysis of som...
Questions

Chemistry, 21.04.2020 12:05

English, 21.04.2020 12:06
English, 21.04.2020 12:08
Mathematics, 21.04.2020 12:10

Mathematics, 21.04.2020 12:11
Mathematics, 21.04.2020 12:11
Mathematics, 21.04.2020 12:11
English, 21.04.2020 12:11

Mathematics, 21.04.2020 12:11
English, 21.04.2020 12:12
Mathematics, 21.04.2020 12:12
Mathematics, 21.04.2020 12:12
History, 21.04.2020 12:12


