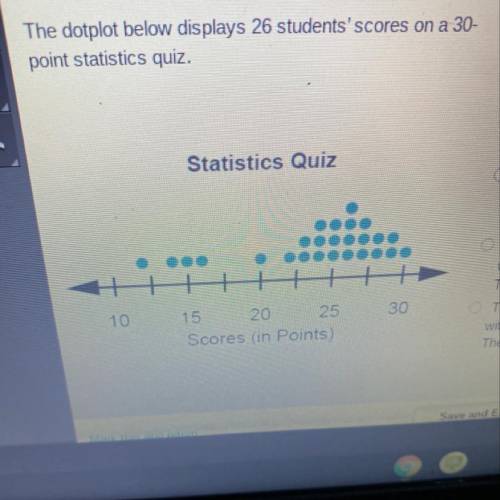
The dotplot below displays 26 students' scores on a 30-
point statistics quiz.
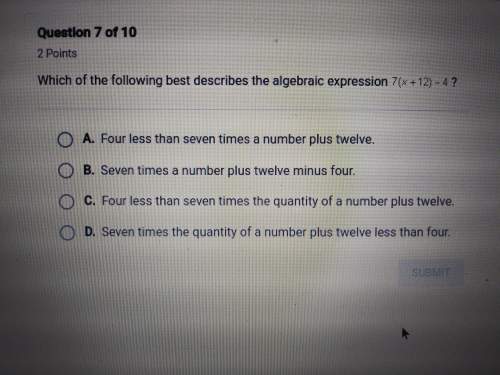
Which of the f...

Mathematics, 04.11.2020 23:30 garcikyl000
The dotplot below displays 26 students' scores on a 30-
point statistics quiz.
Which of the following statements best describes the
dotplot?
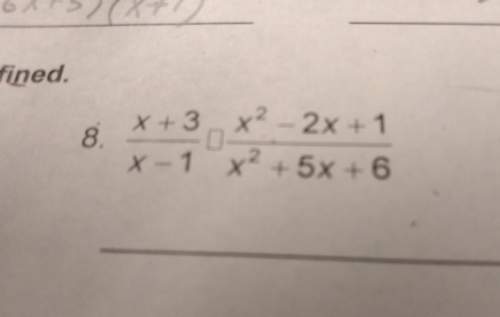
Statistics Quiz
The distribution of quiz scores is skewed left with a
center around 24 and varies from 12 to 30. There are
possible outliers at 12, 14, 15, and 16.
The distribution of quiz scores is skewed right with a
center around 24 and varies from 12 to 30. There are
possible outliers at 12, 14, 15, and 16.
The distribution of quiz scores is unimodal symmetric
with a center around 24 and varies from 12 to 30.
There are possible outliers at 12, 14, 15, and 16.
The distribution of quiz scores is unimodal symmetric
with a center around 26 and varies from 20 to 30.
There are possible outliers at 12, 14, 15, and 16.
10
30
15 20 25
Scores (in Points)

Answers: 1


Another question on Mathematics
Mathematics, 21.06.2019 19:30
The cone in the diagram has the same height and base area as the prism. what is the ratio of the volume of the cone to the volume of the prism? h hl base area-b base area =b volume of cone_1 volume of prism 2 volume of cone 1 volume of prism 3 volume of cone 2 volume of prism 3 oc. od. volume of cone volume of prism e. volume of cone volume of prism 3 2
Answers: 3
Mathematics, 22.06.2019 02:00
The table below shows the number of free throw shots attempted and the number of shots made for the five starting players on the basketball team during practice. each player's goal is to make 80% of her shots.
Answers: 1
You know the right answer?
Questions

Biology, 12.04.2021 22:10


Mathematics, 12.04.2021 22:10

Geography, 12.04.2021 22:10
English, 12.04.2021 22:10
Mathematics, 12.04.2021 22:10


Biology, 12.04.2021 22:10

Physics, 12.04.2021 22:10


