
Mathematics, 04.11.2020 16:40 yasarhan2
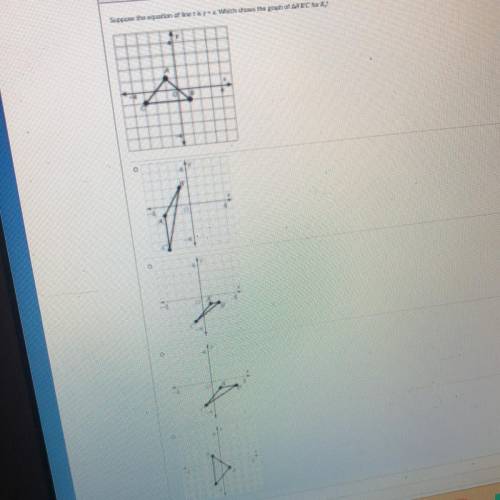
I’ll give brainliest please help Suppose the equation of line t is y = x. Which shows the graph of A’B’C’ for Rt?

Answers: 1


Another question on Mathematics
Mathematics, 21.06.2019 20:40
David estimated he had about 20 fish in his pond. a year later, there were about 1.5 times as many fish. the year after that, the number of fish increased by a factor of 1.5 again. the number of fish is modeled by f(x)=20(1.5)^x. create a question you could ask that could be answered only by graphing or using a logarithm.
Answers: 1
Mathematics, 21.06.2019 22:00
After a dreary day of rain, the sun peeks through the clouds and a rainbow forms. you notice the rainbow is the shape of a parabola. the equation for this parabola is y = -x2 + 36. graph of a parabola opening down at the vertex 0 comma 36 crossing the x–axis at negative 6 comma 0 and 6 comma 0. in the distance, an airplane is taking off. as it ascends during take-off, it makes a slanted line that cuts through the rainbow at two points. create a table of at least four values for the function that includes two points of intersection between the airplane and the rainbow. analyze the two functions. answer the following reflection questions in complete sentences. what is the domain and range of the rainbow? explain what the domain and range represent. do all of the values make sense in this situation? why or why not? what are the x- and y-intercepts of the rainbow? explain what each intercept represents. is the linear function you created with your table positive or negative? explain. what are the solutions or solution to the system of equations created? explain what it or they represent. create your own piecewise function with at least two functions. explain, using complete sentences, the steps for graphing the function. graph the function by hand or using a graphing software of your choice (remember to submit the graph).
Answers: 2
Mathematics, 22.06.2019 01:30
In 2000, for a certain region, 27.1% of incoming college freshman characterized their political views as liberal, 23.1% as moderate, and 49.8% as conservative. for this year, a random sample of 400 incoming college freshman yielded the frequency distribution for political views shown below. a. determine the mode of the data. b. decide whether it would be appropriate to use either the mean or the median as a measure of center. explain your answer. political view frequency liberal 118 moderate 98 conservative 184 a. choose the correct answer below. select all that apply. a. the mode is moderate. b. the mode is liberal. c. the mode is conservative. d. there is no mode.
Answers: 1
Mathematics, 22.06.2019 02:10
Which option identifies how kevin should proceed in the following scenario? four years ago kevin designed an mp3 player for young children. now that technology has changed, he would like to update his design to ensure that it encompasses cutting-edge techniques. by creating a third-angle projection of his ideas by designing an isometric projection of his new ideas by referring to past designs and illustrations of his original model by conferring with engineers who have improved upon similar devices
Answers: 3
You know the right answer?
I’ll give brainliest please help
Suppose the equation of line t is y = x. Which shows the graph of...
Questions

History, 26.10.2020 21:40
Mathematics, 26.10.2020 21:40
Mathematics, 26.10.2020 21:40

Biology, 26.10.2020 21:40


Advanced Placement (AP), 26.10.2020 21:40

Biology, 26.10.2020 21:40
Biology, 26.10.2020 21:40
English, 26.10.2020 21:40
Arts, 26.10.2020 21:40
Mathematics, 26.10.2020 21:40
Mathematics, 26.10.2020 21:40


Health, 26.10.2020 21:40


