Graphing a Step Function
Ty
y
х
Graph: f(3) =
-2,-6<< < -1
1...

Mathematics, 04.11.2020 08:20 alleahbethea199
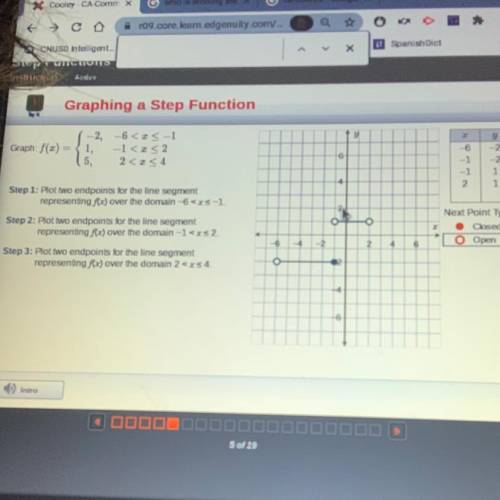
Graphing a Step Function
Ty
y
х
Graph: f(3) =
-2,-6<< < -1
1,
-1
5, 2 <<4
6
-6
-1
-1
2
y
-2
-2
1
1
4
Step 1: Plot two endpoints for the line segment
representing f(x) over the domain -6
2
O
O
X
Step 2: Plot two endpoints for the line segment
representing f(x) over the domain -1
Step 3: Plot two endpoints for the line segment
representing f(x) over the domain 2
Next Point Type
Closed
O Open
-6
-4.
-2
2
2
4
6
00
2
-4
-6
Intro

Answers: 3


Another question on Mathematics
Mathematics, 21.06.2019 13:10
Next, chad created this graph with ordered pairs that show the possible ratios of the number of damage to defense cards in his deck.what error chad make?
Answers: 1
Mathematics, 21.06.2019 22:30
How can you find the mean absolute deviation (mad) for this set of data?
Answers: 3
Mathematics, 21.06.2019 23:00
What adds to be the bottom number but also multiplies to be the top number with 8 on the bottom and 15 on top
Answers: 2
Mathematics, 22.06.2019 00:50
There are 8 movies that you would like to see currently showing in theatres. in how many different ways can you choose a movie to see this saturday and one to see this sunday?
Answers: 1
You know the right answer?
Questions


Chemistry, 23.09.2019 16:00


Social Studies, 23.09.2019 16:00

History, 23.09.2019 16:00

Computers and Technology, 23.09.2019 16:00

Physics, 23.09.2019 16:00
Mathematics, 23.09.2019 16:00

Geography, 23.09.2019 16:00

English, 23.09.2019 16:00
History, 23.09.2019 16:00
Mathematics, 23.09.2019 16:00
Mathematics, 23.09.2019 16:00


