
Mathematics, 04.11.2020 07:50 alayciaruffin076
Question 4
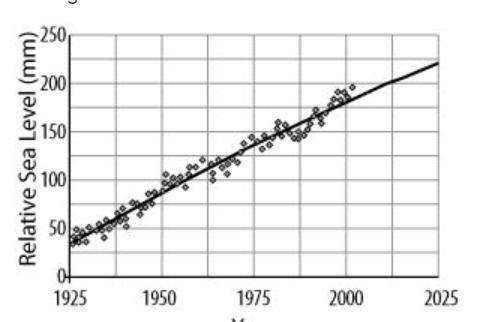
The figure shows the actual increase in sea level between the years 1925 and 2000 (shown by the points) and a mathematical model that has been fitted to the data (shown by the line).
image 5afdca68eca248c59dbe6c57ceabf51b
Based on the model in the graph, which is the best estimate of the average annual increase in sea level expected between the years 2000 and 2025?
A
1.6 mm/year
B
1.9 mm/year
C
40 mm/year
D
150 mm/year

Answers: 3


Another question on Mathematics
Mathematics, 21.06.2019 14:30
Your friend swims on the school team. in his first four races, his times are 24.7, 23.5, 25.6, and 27.2 seconds. which time listed for his next race would make the range larger?
Answers: 1
Mathematics, 21.06.2019 20:10
A. use the formula for continuous compounding with the original example: $1000 invested at 2% for 1 year. record the amount to 5 decimal places. use a calculator. b. compare it to the result using the original compound interest formula with n = 365 calculated to 5 decimal places. which has a larger value? explain.
Answers: 1
Mathematics, 21.06.2019 20:30
Someone me what is the area of this figure? 18m 18m 8m 16m
Answers: 2
Mathematics, 21.06.2019 22:20
Igure 1 and figure 2 are two congruent parallelograms drawn on a coordinate grid as shown below: 4 quadrant coordinate grid showing two parallelograms. figure 1 has vertices at negative 5, 2 and negative 3, 4 and negative 4, 7 and negative 6, 5. figure 2 has vertices at 5, negative 2 and 7, negative 4 and 6, negative 7 and 4, negative 5. which two transformations can map figure 1 onto figure 2? reflection across the y-axis, followed by reflection across x-axis reflection across the x-axis, followed by reflection across y-axis reflection across the x-axis, followed by translation 10 units right reflection across the y-axis, followed by translation 5 units down
Answers: 1
You know the right answer?
Question 4
The figure shows the actual increase in sea level between the years 1925 and 2000 (shown...
Questions


Geography, 29.08.2019 20:20


Computers and Technology, 29.08.2019 20:20

Computers and Technology, 29.08.2019 20:20

Medicine, 29.08.2019 20:20
Mathematics, 29.08.2019 20:30


