
Mathematics, 04.11.2020 03:10 acalvario2019
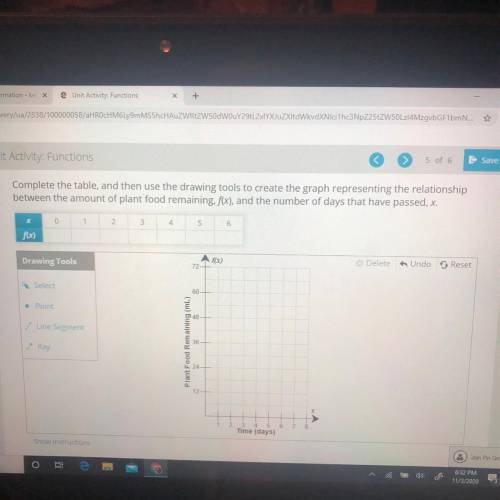
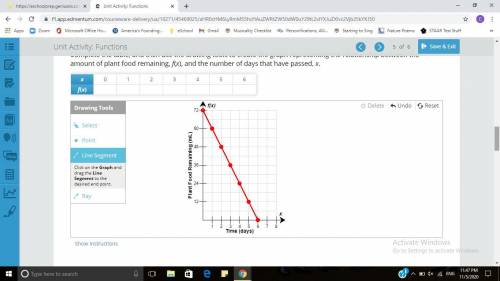
Complete the table, and then use the drawing tools to create the graph representing the relationship
between the amount of plant food remaining, fix), and the number of days that have passed, X.
For
х
0
1
2
3
4
5
6
f(x)
Drawing Tools
f(x)
ents
Delete Undo Reset
72
Select
80
• Point
048
Line Segment
Plant Food Remaining (mL)
36
7 Ray
12
Time (days)
Show instructions
son Pro Group
I am completely stumped on this graphing if anyone remembers the math problem where Ryan is conducting a 6 day study observing the effects of an organic plant food on the growth of his sprouting bean plant. He tracked amount of plant food remaining in container after each days feeding and the height of the plant over time.
Ryan found that the amount of plant food remaining decreased an equal amount each day and he used the entire 72ml by the end of his study. Function rule f(x)=amount of plant food remaining and x is number of days passed.
I think domain is 0
CAN ANYONE HELP ME?

Answers: 2


Another question on Mathematics
Mathematics, 21.06.2019 22:00
Here is my question! jayne is studying urban planning and finds that her town is decreasing in population by 3% each year. the population of her town is changing by a constant rate.true or false?
Answers: 2
Mathematics, 22.06.2019 01:20
Construct a box plot to represent the ages of the actors in a play. step 1: arrange the numbers in order from lowest (on the left) to highest. 24 18 30 26 24 33 32 44 25 28
Answers: 3
Mathematics, 22.06.2019 03:00
The dimension of the rectangular pool shown below are 40 yards by 20 yards
Answers: 3
Mathematics, 22.06.2019 03:00
Determine if the sequence is arithmetic or geometric. then identify the next term in the sequence. 0.2, 1, 5, 25, . . group of answer choices arithmetic; 75 geometric; 75 arithmetic; 125 geometric; 125
Answers: 1
You know the right answer?
Complete the table, and then use the drawing tools to create the graph representing the relationship...
Questions


Biology, 30.10.2020 17:20


Chemistry, 30.10.2020 17:20

Law, 30.10.2020 17:20
English, 30.10.2020 17:20
Mathematics, 30.10.2020 17:20
Mathematics, 30.10.2020 17:20
Mathematics, 30.10.2020 17:20


Computers and Technology, 30.10.2020 17:20


