
Mathematics, 02.11.2020 19:00 lazerlemon500
1.The proportion of all samples randomly drawn from the population whose confidence intervals contain the estimated population parameter is the
point estimate.
standard error.
margin of error.
confidence level.
2.A random sample of 1,026 adults in the United States were asked: "Based on what you know about the current Health care system today, what would you like Congress and the President to do during this next year?" Their responses are shown in the table.
Construct a 90% confidence interval for the proportion of all United States adults who think, at the very least, major changes are needed.
3.Based on a random sample of 36 students, it was found that 27 of them have a pet. What is a 95% confidence interval for the proportion of students that have a pet?
0.75 ± 0.25
0.75 ± 0.01
0.75 ± 0.07
0.75 ± 0.19
4.A candy manufacturer claims that no more than 2% of its individually wrapped chocolate candy pieces are missing nuts. A random sample of 100 candy pieces shows that 3 are missing nuts. For α = 0.05, which statement is true?
The candy manufacturer’s claim is likely true, as evidenced by a z-score that is less 1.645.
The candy manufacturer’s claim is likely true, as evidenced by a z-score that is equal to 1.645.
The candy manufacturer’s claim is likely untrue, as evidenced by a z-score that is less than 1.645.
The candy manufacturer’s claim is likely true, as evidenced by a z-score that is greater than 1.645.
5.A survey was conducted to determine the percentage of twelfth grade students who planned to go to college. The results indicated 78% with a margin of error of ±5.
What is meant by ±5?
10% of the population of twelfth grade students was not surveyed.
It is unlikely a sample proportion result of 78% would be obtained unless the true percentage is between 73% and 83%.
For the sample, the percentage of students who plan to go to college was between 73% and 83%
The percentage of the entire population of students who plan to go to college is between 73% and 83%.
6.The CDC reports that 14.9% of all US deaths are attributable to heart disease. In Mississippi, a random sample of 500 death certificates were examined and 124 of them were attributable to heart disease. Construct an 85% confidence Interval for the actual proportion of Mississippi deaths that are from heart disease.
7.A random sample of 1,026 adults in the United States were asked: "Based on what you know about the current Health care system today, what would you like Congress and the President to do during this next year?" Their responses are shown in the table.
Construct a 90% confidence interval for the proportion of all United States adults who think some type of change is needed.
8.A city newspaper selected a simple random sample of 3,800 readers from their list of subscribers. They asked whether the newspaper should increase its local sports coverage.
If 34.5% of the sample wanted more coverage of local sports, what is the 95% confidence interval for the proportion of readers who would like more coverage of local sports?
(0.30, 0.39)
(0.31, 0.38)
(0.32, 0.37)
(0.33, 0.36)
9.A city newspaper selected a simple random sample of 3,800 readers from their list of subscribers. They asked whether the newspaper should increase its local sports coverage.
Based on the 34.5% of readers who wanted more coverage of local sports, the newspaper decides to determine a 99% confidence interval. What is the 99% confidence interval for the proportion of readers who would like more coverage of local sports?
(0.319, 0.371)
(0.325, 0.365)
(0.340, 0.353)
None of the above

Answers: 1


Another question on Mathematics
Mathematics, 21.06.2019 14:00
Given the conditional statement, match the following. conditional statement: if two lines intersect, then their intersection is one point.
Answers: 1
Mathematics, 21.06.2019 17:00
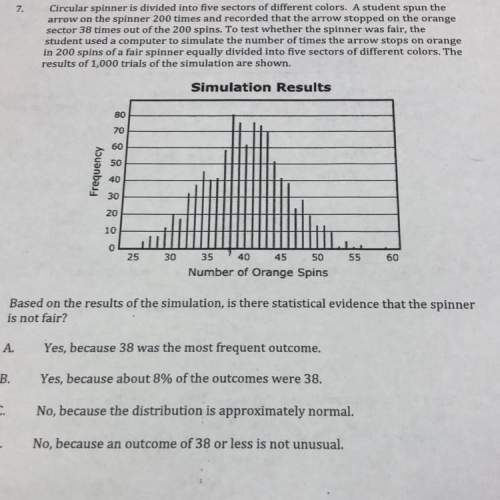
In tossing one coin 10 times, what are your chances for tossing a head? a tail? 2. in tossing one coin 100 times, what are your chances for tossing a head? a tail? 3. in tossing one coin 200 times, what are your chances for tossing a head? a tail? deviation = ((absolute value of the difference between expected heads and observed heads) + (absolute value of the difference between expected tails and observed tails)) divided by total number of tosses. this value should always be positive. 4. what is the deviation for 10 tosses? 5. what is the deviation for the 100 tosses? 6. what is the deviation for 200 tosses? 7. how does increasing the total number of coin tosses from 10 to 100 affect the deviation? 8. how does increasing the total number of tosses from 100 to 200 affect the deviation? 9. what two important probability principles were established in this exercise? 10. the percent of occurrence is the obtained results divided by the total tosses and multiplied by 100%. toss the coins 100 times and record your results. calculate the percent occurrence for each combination. percent head-head occurrence: percent tail-tail occurrence: percent head-tail occurrence:
Answers: 3
Mathematics, 21.06.2019 18:20
Inez has a phone card. the graph shows the number of minutes that remain on her phone card a certain number of days.
Answers: 2
Mathematics, 21.06.2019 19:00
Quadrilateral abcd in the figure below represents a scaled-down model of a walkway around a historic site. quadrilateral efgh represents the actual walkway. abcd is similar to efgh. what is the total length, in feet of the actual walkway?
Answers: 2
You know the right answer?
1.The proportion of all samples randomly drawn from the population whose confidence intervals contai...
Questions

Social Studies, 24.01.2020 00:31

Computers and Technology, 24.01.2020 00:31
Computers and Technology, 24.01.2020 00:31


