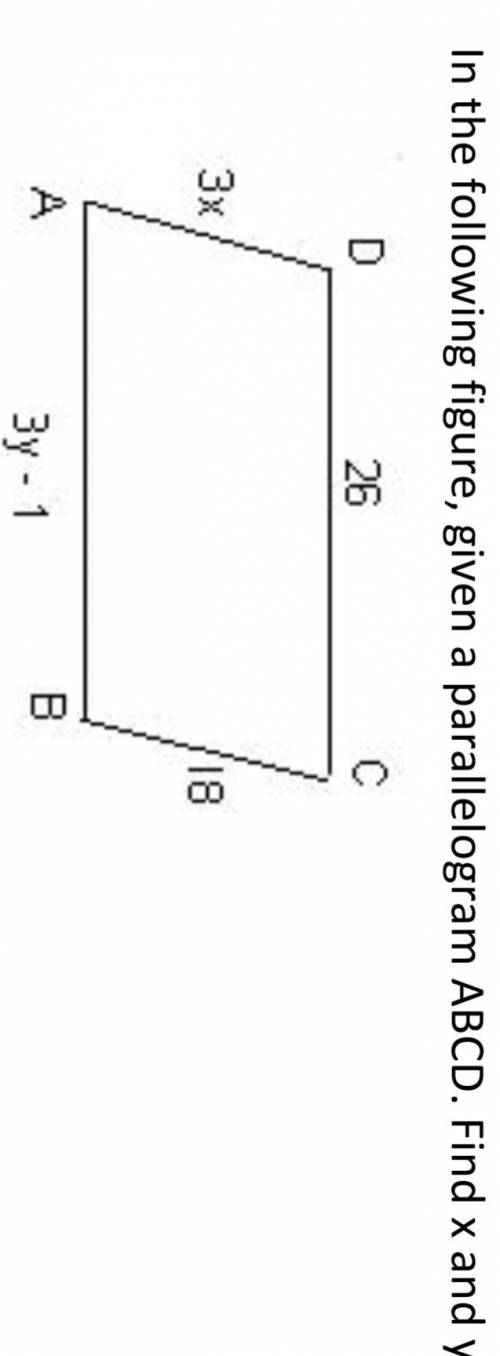
In the following figure, given a parallelogram ABCD. Find x and y
...

Mathematics, 30.10.2020 17:00 edjiejwi
In the following figure, given a parallelogram ABCD. Find x and y

Answers: 2


Another question on Mathematics
Mathematics, 21.06.2019 16:30
Arestaurant gives out a scratch-off card to every customer. the probability that a customer will win a prize from a scratch-off card is 25%. design and conduct a simulation using random numbers to find the experimental probability that a customer will need more than 3 cards in order to win a prize. justify the model for your simulation, and conduct at least 10 trials.
Answers: 1
Mathematics, 21.06.2019 21:50
Desmond wants to sell his car that he paid $8,000 for 2 years ago. the car depreciated, or decreased in value, at a constant rate each month over a 2-year period. if x represents the monthly depreciation amount, which expression shows how much desmond can sell his car for today? 8,000 + 24x 8,000 - 24x 8,000 + 2x 8,000 - 2xdesmond wants to sell his car that he paid $8,000 for 2 years ago. the car depreciated, or decreased in value, at a constant rate each month over a 2-year period. if x represents the monthly depreciation amount, which expression shows how much desmond can sell his car for today? 8,000 + 24x 8,000 - 24x 8,000 + 2x 8,000 - 2x
Answers: 1
Mathematics, 22.06.2019 03:00
Describe how the presence of possible outliers might be identified on the following. (a) histograms gap between the first bar and the rest of bars or between the last bar and the rest of bars large group of bars to the left or right of a gap higher center bar than surrounding bars gap around the center of the histogram higher far left or right bar than surrounding bars (b) dotplots large gap around the center of the data large gap between data on the far left side or the far right side and the rest of the data large groups of data to the left or right of a gap large group of data in the center of the dotplot large group of data on the left or right of the dotplot (c) stem-and-leaf displays several empty stems in the center of the stem-and-leaf display large group of data in stems on one of the far sides of the stem-and-leaf display large group of data near a gap several empty stems after stem including the lowest values or before stem including the highest values large group of data in the center stems (d) box-and-whisker plots data within the fences placed at q1 â’ 1.5(iqr) and at q3 + 1.5(iqr) data beyond the fences placed at q1 â’ 2(iqr) and at q3 + 2(iqr) data within the fences placed at q1 â’ 2(iqr) and at q3 + 2(iqr) data beyond the fences placed at q1 â’ 1.5(iqr) and at q3 + 1.5(iqr) data beyond the fences placed at q1 â’ 1(iqr) and at q3 + 1(iqr)
Answers: 1
You know the right answer?
Questions

Arts, 30.04.2021 04:10
Mathematics, 30.04.2021 04:10

Chemistry, 30.04.2021 04:10

Computers and Technology, 30.04.2021 04:10

Mathematics, 30.04.2021 04:10
Mathematics, 30.04.2021 04:10
English, 30.04.2021 04:10

Spanish, 30.04.2021 04:10
Chemistry, 30.04.2021 04:10
Mathematics, 30.04.2021 04:10

History, 30.04.2021 04:10
History, 30.04.2021 04:10

Mathematics, 30.04.2021 04:10


