
Mathematics, 28.10.2020 01:40 jadahilbun01
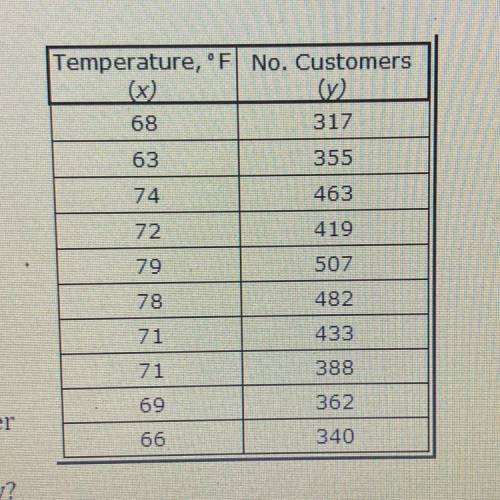
The table to the right is the data an ice cream store collected. They measured the
temperature every day and counted how many customers they had. Given the table:
a. Find the LSRL
b. Find the correlation coefficient
c. Given the correlation how good of a fit is
the line to the data points?
d. Predict f(85)
e. Do you think the prediction of the number
of customers for an 85-degree day from
part "d" is a good or bad prediction? Why?

Answers: 2


Another question on Mathematics
Mathematics, 21.06.2019 16:20
Apolynomial function has a root of –6 with multiplicity 1, a root of –2 with multiplicity 3, a root of 0 with multiplicity 2, and a root of 4 with multiplicity 3. if the function has a positive leading coefficient and is of odd degree, which statement about the graph is true?
Answers: 2
Mathematics, 21.06.2019 20:00
Two line segments are shown in the figure below. suppose that the length of the line along the x-axis is 6, and the length of the hypotenuse of the triangle is 10. what is the equation of the hypotenuse line (shown in red, below)?
Answers: 3
Mathematics, 22.06.2019 00:30
How many square centimeters of wrapping paper will be used to wrap the shoe box?
Answers: 2
You know the right answer?
The table to the right is the data an ice cream store collected. They measured the
temperature ever...
Questions
Mathematics, 31.07.2020 03:01


Mathematics, 31.07.2020 03:01

Biology, 31.07.2020 03:01
Mathematics, 31.07.2020 03:01
Mathematics, 31.07.2020 03:01
Mathematics, 31.07.2020 03:01
Mathematics, 31.07.2020 03:01
Mathematics, 31.07.2020 03:01

English, 31.07.2020 03:01


