
Mathematics, 22.10.2020 01:01 fryday2516
7.(06.02)
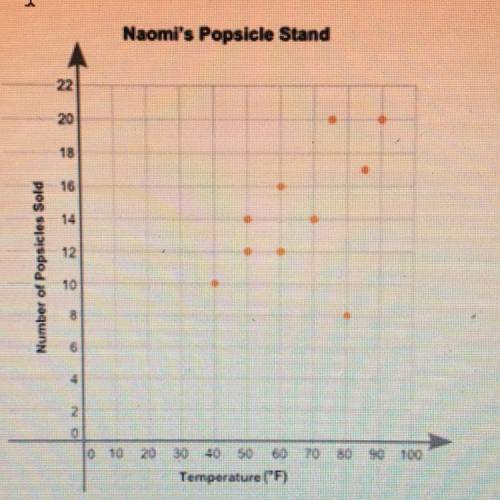
Nami plotted the graph below to show the relationship between the temperature of her city and the number of popsides she old day:
Now Popsicle Stand
Part A In your own words, describe the relationship between the temperature of the city and the number of popsicles sold. (2 points)
Part B: Describe how you can make the line of best fit. Write the approximate slope and intercept of the line of best fit Show your work, including the points that you use to calculate the scope and yet
points)

Answers: 2


Another question on Mathematics
Mathematics, 21.06.2019 16:50
For the equations below which statement is true ? -2x=14 6x=-42
Answers: 1
Mathematics, 21.06.2019 18:30
The monetary value earned for selling goods or services to customers is called a.) revenue b.) assets c.) money d.) accounting
Answers: 2
Mathematics, 21.06.2019 18:40
Which of the following represents the range of the graph of f(x) below
Answers: 1
You know the right answer?
7.(06.02)
Nami plotted the graph below to show the relationship between the temperature of her city...
Questions

English, 12.11.2020 06:00
Mathematics, 12.11.2020 06:00
English, 12.11.2020 06:00

Health, 12.11.2020 06:00

Biology, 12.11.2020 06:00

Mathematics, 12.11.2020 06:00

History, 12.11.2020 06:00
Mathematics, 12.11.2020 06:10

Arts, 12.11.2020 06:10
Mathematics, 12.11.2020 06:10


