
Mathematics, 16.10.2020 14:01 naomiedgrey
NEED THIS ASAP
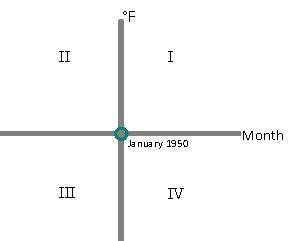
You work for the National Weather Service and are asked to study the average daily temperatures in Anchorage, Alaska. You calculate the mean of the average daily temperatures for each month. You decide to place the information on a graph in which the date is the input and the temperature is the output. You also decide that January 1950 will correspond to the month 0 as indicated by the dot on the input scale.
On a coordinate plane, quadrants 1, 2, 3, and 4 are labeled. Month is on the x-axis and degrees Fahrenheit is on the y-axis.
Determine the quadrant in which you would plot the points that correspond to the following data:
The average daily temperature for July 1910 was 71 degreesF.
a.
Quadrant III
b.
Quadrant IV
c.
Quadrant II
d.
Quadrant I
Please select the best answer from the choices provided
A
B
C
D

Answers: 2


Another question on Mathematics
Mathematics, 21.06.2019 14:00
Lorenzo ate 2/5 of his bag of almonds. his 4 friends ate equal shares of the remaining bag of almonds?
Answers: 1
Mathematics, 21.06.2019 16:00
Given right triangle xyz, which correctly describes the locations of the sides in relation to
Answers: 1
Mathematics, 21.06.2019 18:10
Drag the tiles to the boxes to form correct pairs. not all tiles will be used. match each set of vertices with the type of quadrilateral they form
Answers: 3
Mathematics, 21.06.2019 23:30
The scatterplot represents the total fee for hours renting a bike. the line of best fit for the data is y = 6.855x + 10.215. which table shows the correct residual values for the data set?
Answers: 1
You know the right answer?
NEED THIS ASAP
You work for the National Weather Service and are asked to study the average daily t...
Questions
Mathematics, 03.09.2019 17:10


Computers and Technology, 03.09.2019 17:10


