
Mathematics, 16.10.2020 14:01 kadariusmerchan
The following data represent the high-temperature distribution for a summer month in a city for some of the last 130 years. Treat the data as a population. Complete parts (a) through (c).
Temperature Lower Limit Upper Limit Days
50-59 50 59 2
60-69 60 69 313
70-79 70 79 1419
80-89 80 89 1503
90-99 90 99 319
100-109 100 109 9
Required:
Approximate the mean and standard deviation for temperature.

Answers: 1


 Days
Days

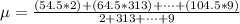
![\sigma = \sqrt{ \frac{\sum[ f_i * ( x_i^2 - \= x^2)] }{\sum f_i}}](/tpl/images/0810/8032/769d0.png)
![\sigma =\sqrt{ \frac{[2 * [(54.5)^2) - 79.7^2 ]]+[313 *[ (64.5)^2)-79.7^2] +\cdots +[9 *[ (104.5)^2)- 79.7^2] }{2 + 313 +\cdots + 9}}](/tpl/images/0810/8032/2aaa3.png)


Another question on Mathematics
Mathematics, 21.06.2019 17:30
Choose the number sentence that shows the identity property of addition. a. 122 = 61 + 61 b. 62 = 1 + 61 c. 61 = 0 + 61
Answers: 1
Mathematics, 21.06.2019 22:10
Gravel is being dumped from a conveyor belt at a rate of 25 ft3/min, and its coarseness is such that it forms a pile in the shape of a cone whose base diameter and height are always equal. how fast is the height of the pile increasing when the pile is 14 ft high? (round your answer to two decimal places.) ft/min
Answers: 3
Mathematics, 22.06.2019 00:30
Nellie is analyzing a quadratic function f(x) and a linear function g(x). will they intersect? f(x) g(x) graph of the function f of x equals one half times x squared, plus 2 x g(x) 1 5 2 10 3 15
Answers: 2
Mathematics, 22.06.2019 06:00
Each weekday davina rides her bike from her house to school. after school, she rides to the library. then davina takes the same route to get home. these locations are shown on the grid below, where 1 unit on the grid represents 1 kilometer. how many kilometers does she ride each day? 10 16 20 32
Answers: 3
You know the right answer?
The following data represent the high-temperature distribution for a summer month in a city for some...
Questions
Mathematics, 05.03.2021 20:00


Arts, 05.03.2021 20:00
Mathematics, 05.03.2021 20:00
Mathematics, 05.03.2021 20:00

Chemistry, 05.03.2021 20:00
English, 05.03.2021 20:00

French, 05.03.2021 20:00
Mathematics, 05.03.2021 20:00
English, 05.03.2021 20:00
English, 05.03.2021 20:00
Mathematics, 05.03.2021 20:00

History, 05.03.2021 20:00
Mathematics, 05.03.2021 20:00

Mathematics, 05.03.2021 20:00


