
Mathematics, 12.10.2020 19:01 Kazya4
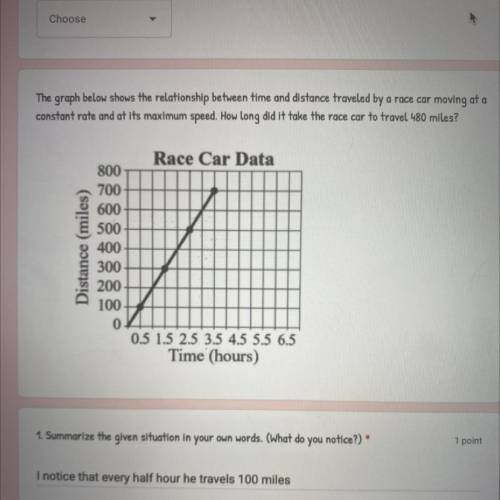
The graph below shows the relationship between time and distance traveled by a race car moving at a
constant rate and at its maximum speed. How long did it take the race car to travel 480 miles?
Race Car Data
Distance (miles)
800
700
600
500
400
300
200
100
0
0.5 1.5 2.5 3.5 4.5 5.5 6.5
Time (hours)

Answers: 1


Another question on Mathematics
Mathematics, 21.06.2019 20:20
Aline passes through (1,-5) and(-3,7) write an equation for the line in point slope form rewrite the equation in slope intercept form
Answers: 1
Mathematics, 21.06.2019 23:20
1. ∠1 is complementary to ∠2 and ∠3 is complementary to ∠2. subtraction property of equality 2. m∠1 + m∠2 = 90 and m∠3 + m∠2 = 90 substitution 3. m∠1 + m∠2 = m∠3 + m∠2 definition of complementary 4. m∠1 = m∠3 given
Answers: 3
Mathematics, 21.06.2019 23:40
Will give brainliest b. describe the function over each part of its domain. state whether it is constant, increasing, or decreasing, and state the slope over each part.
Answers: 1
You know the right answer?
The graph below shows the relationship between time and distance traveled by a race car moving at a...
Questions


History, 01.08.2019 19:00


Geography, 01.08.2019 19:00

English, 01.08.2019 19:00
Mathematics, 01.08.2019 19:00
History, 01.08.2019 19:00
Chemistry, 01.08.2019 19:00

Social Studies, 01.08.2019 19:00


