
Mathematics, 12.10.2020 14:01 rscott400
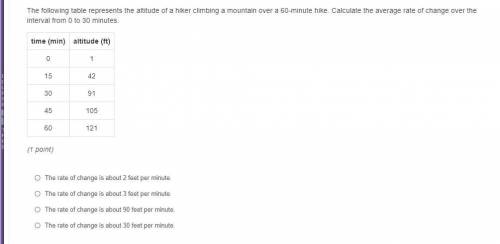
1.The following table represents the altitude of a hiker climbing a mountain over a 60-minute hike. Calculate the average rate of change over the interval from 0 to 30 minutes.
A. The rate of change is about 2 feet per minute.
B. The rate of change is about 3 feet per minute.
C. The rate of change is about 90 feet per minute.
D. The rate of change is about 30 feet per minute.
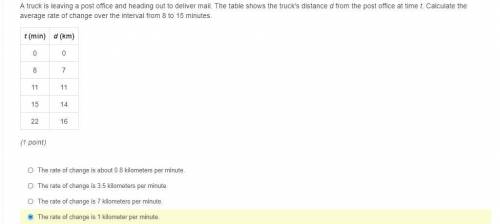
2.A truck is leaving a post office and heading out to deliver mail. The table shows the truck's distance d from the post office at time t. Calculate the average rate of change over the interval from 8 to 15 minutes.
A. The rate of change is about 0.8 kilometers per minute.
B. The rate of change is 3.5 kilometers per minute.
C. The rate of change is 7 kilometers per minute.
D. The rate of change is 1 kilometer per minute.
3.Isaac knew he had to to study more in order to improve his math grades. Calculate the average rate of change over the interval from his first exam to his third exam.
A. The rate of change is 12 percent per exam.
B. The rate of change is 2 percent per exam.
C. The rate of change is about 5.5 percent per exam.
D. The rate of change is 6 percent per exam.
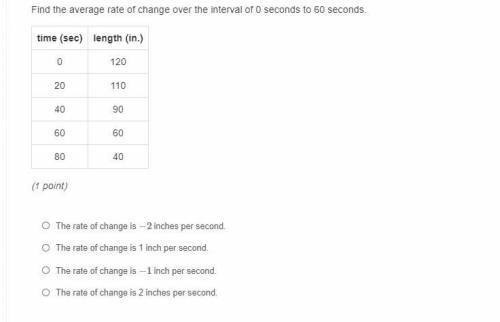
4.Find the average rate of change over the interval of 0 seconds to 60 seconds.
A. The rate of change is −2 inches per second.
B. The rate of change is 1 inch per second.
C. The rate of change is −1 inch per second.
D. The rate of change is 2 inches per second.
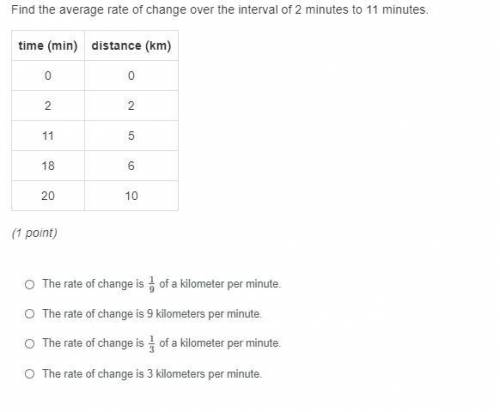
5.Find the average rate of change over the interval of 2 minutes to 11 minutes.
A. The rate of change is 19 of a kilometer per minute.
B. The rate of change is 9 kilometers per minute.
C. The rate of change is 13 of a kilometer per minute.
D. The rate of change is 3 kilometers per minute.
If you answer please answer with all of the with all of the questions listed thank you.


Answers: 2


Another question on Mathematics
Mathematics, 21.06.2019 23:30
If a runner who runs at a constant speed of p miles per hour runs a mile in exactly p minutes what is the integer closest to the value p
Answers: 2
Mathematics, 22.06.2019 01:30
12.0 million metric tons of beef produced annually in the u.s. out if 65.1 mikkion metric tons of produced annually worldwide
Answers: 1
Mathematics, 22.06.2019 02:00
The table below shows the number of free throw shots attempted and the number of shots made for the five starting players on the basketball team during practice. each player's goal is to make 80% of her shots. players number of free throws made free throw attempts kelly 16 20 sarah 25 30 maggie 31 40 liz 44 50 kim 47 60 how many players made at least 80% of their shots? round to the nearest percent.
Answers: 1
Mathematics, 22.06.2019 03:00
Dana wants to identify the favorite professional baseball team of people in her community. she stands outside a local sporting goods store and asks every other person who enters, "what is your favorite professional baseball team? " will the results of her survey be valid? explain.
Answers: 1
You know the right answer?
1.The following table represents the altitude of a hiker climbing a mountain over a 60-minute hike....
Questions

History, 25.05.2021 21:20


Mathematics, 25.05.2021 21:20


English, 25.05.2021 21:20
Mathematics, 25.05.2021 21:20
Mathematics, 25.05.2021 21:20


