
Mathematics, 07.10.2020 09:01 juliann9160
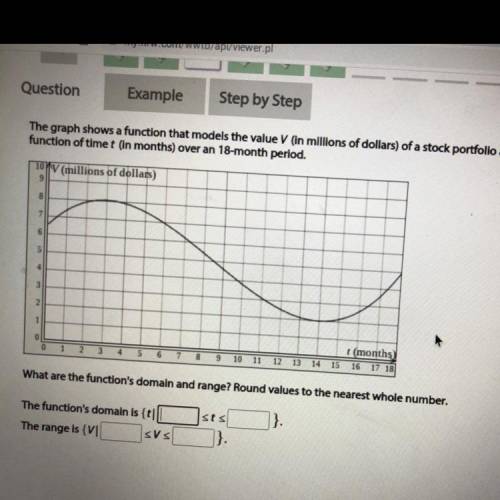
The graph shows a function that models the value V (in millions of dollars) of a stock portfolio as a
function of timet (In months) over an 18-month period.
10 V (millions of dollars)
9
8
7
6
s
4
3
2
1
0
0
t(months
3 4 5 6 7 8 9 10 11 12 13 14 15 16 17 18
What are the function's domain and range? Round values to the nearest whole number.
The function's domain is {t|
The range is {V1 SVS
}
sts
}

Answers: 1


Another question on Mathematics
Mathematics, 21.06.2019 16:30
Read the following two statements. then use the law of syllogism to draw a conclusion. if the tv is too loud, then it will give me a headache. if i have a headache, then i will have to rest.
Answers: 2
Mathematics, 21.06.2019 18:10
If a || b and b | y, then ? a) x || y. b) x | a. c) a | y. d) a || y.
Answers: 1
Mathematics, 21.06.2019 19:30
Arestaurant charges $100 to rent its banquet room for an event. it also charges $15 to serve dinner to each guest. write an equation for the total cost of the banquet room in terms of the number of guests. deine your variables. what is the total cost of the banquet room for 20 guests?
Answers: 1
You know the right answer?
The graph shows a function that models the value V (in millions of dollars) of a stock portfolio as...
Questions
Mathematics, 15.10.2019 04:30

History, 15.10.2019 04:30

Business, 15.10.2019 04:30
Mathematics, 15.10.2019 04:30


English, 15.10.2019 04:30
Mathematics, 15.10.2019 04:30

History, 15.10.2019 04:30

Social Studies, 15.10.2019 04:30

Chemistry, 15.10.2019 04:30
Mathematics, 15.10.2019 04:30

Computers and Technology, 15.10.2019 04:30


