
Mathematics, 05.10.2020 03:01 robertstoll81
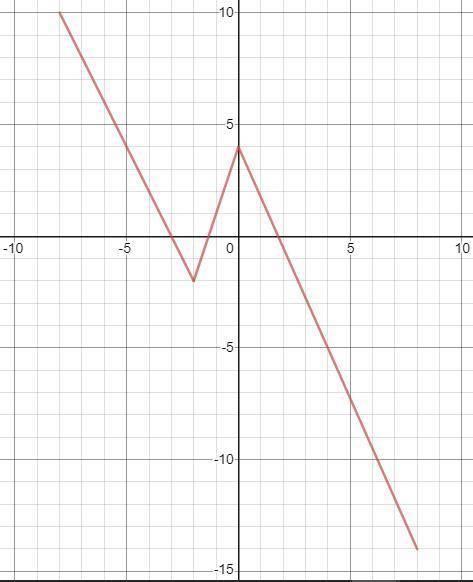
The graph of f(x) is shown below.
For each point (a, b) on the graph of y = f(x), the point ( 3a - 1, b/2) is plotted to form the graph of another function y = g(x). For example, (0,2) lies on the graph of y = f(x), so (3 x 0 - 1, 2/2) = (-1,1) lies on the graph of y = g(x).
(a) Plot the graph of y = g(x). Include the diagram in your solution.
(b) Express g(x) in terms of f(x).
(c) Describe the transformations that you would apply to the graph of y = f(x) to obtain the graph of y = g(x). For example, one transformation might be to stretch the graph horizontally by a factor of 5.

Answers: 1


Another question on Mathematics
Mathematics, 21.06.2019 13:00
If kn = 9 cm, mn = 21 cm, rs = 42 cm, and ps = 18 cm, what is the scale factor of figure klmn to figure pqrs?
Answers: 3
Mathematics, 21.06.2019 18:00
Stephen thublin invests $1,000,000 in a 45-day certificate of deposit with 6.55% interest. what is the total interest income from the investment?
Answers: 1
Mathematics, 21.06.2019 19:30
Weekly wages at a certain factory are normally distributed with a mean of $400 and a standard deviation of $50. find the probability that a worker selected at random makes between $450 and $500
Answers: 2
Mathematics, 21.06.2019 20:00
Simplify (2^5/3^2)^4 a. 2^20/3^8 b. 2^9/3^8 c. 8^5/12^2 d. 2/3^2
Answers: 1
You know the right answer?
The graph of f(x) is shown below.
For each point (a, b) on the graph of y = f(x), the point ( 3a -...
Questions


Mathematics, 12.03.2020 02:38

Mathematics, 12.03.2020 02:38
Mathematics, 12.03.2020 02:38

History, 12.03.2020 02:38
Mathematics, 12.03.2020 02:38

English, 12.03.2020 02:38


