
Mathematics, 29.09.2020 14:01 mimi5261
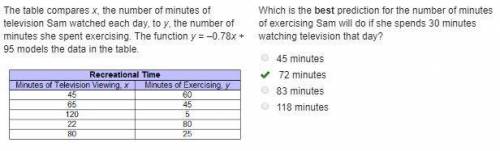
The table compares x, the number of minutes of television Sam watched each day, to y, the number of minutes she spent exercising. The function y = –0.78x + 95 models the data in the table.
A 2-column table with 5 rows. The first column is labeled minutes of television viewing, x with entries 45, 65, 120, 22, 80. The second column is labeled minutes of exercising, y with entries 60, 45, 5, 80, 25.
Which is the best prediction for the number of minutes of exercising Sam will do if she spends 30 minutes watching television that day?
45 minutes
72 minutes
83 minutes
118 minutes

Answers: 3


Another question on Mathematics
Mathematics, 21.06.2019 14:00
Which addition property is being illustrated below? (type commutative or associative) (6 + 7) + 1 = 6 + (7 + 1)
Answers: 1
Mathematics, 21.06.2019 19:00
To solve the system of equations below, pedro isolated the variable y in the first equation and then substituted it into the second equation. what was the resulting equation? { 5y=10x {x^2+y^2=36
Answers: 1
Mathematics, 21.06.2019 21:30
Anumber cube is rolled two times in a row. find the probability it will land on 2 on the first roll and a number greater then 4 on the second roll
Answers: 1
Mathematics, 21.06.2019 21:30
Name and describe the three most important measures of central tendency. choose the correct answer below. a. the mean, sample size, and mode are the most important measures of central tendency. the mean of a data set is the sum of the observations divided by the middle value in its ordered list. the sample size of a data set is the number of observations. the mode of a data set is its highest value in its ordered list. b. the sample size, median, and mode are the most important measures of central tendency. the sample size of a data set is the difference between the highest value and lowest value in its ordered list. the median of a data set is its most frequently occurring value. the mode of a data set is sum of the observations divided by the number of observations. c. the mean, median, and mode are the most important measures of central tendency. the mean of a data set is the product of the observations divided by the number of observations. the median of a data set is the lowest value in its ordered list. the mode of a data set is its least frequently occurring value. d. the mean, median, and mode are the most important measures of central tendency. the mean of a data set is its arithmetic average. the median of a data set is the middle value in its ordered list. the mode of a data set is its most frequently occurring value.
Answers: 3
You know the right answer?
The table compares x, the number of minutes of television Sam watched each day, to y, the number of...
Questions


Mathematics, 06.03.2020 23:24


History, 06.03.2020 23:24

Social Studies, 06.03.2020 23:25


