
Mathematics, 22.09.2020 04:01 mari426
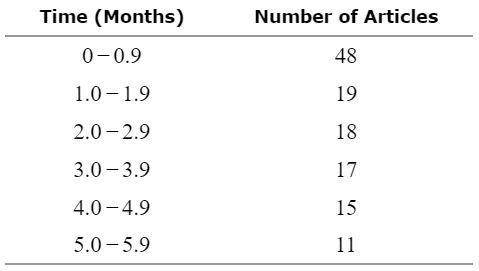
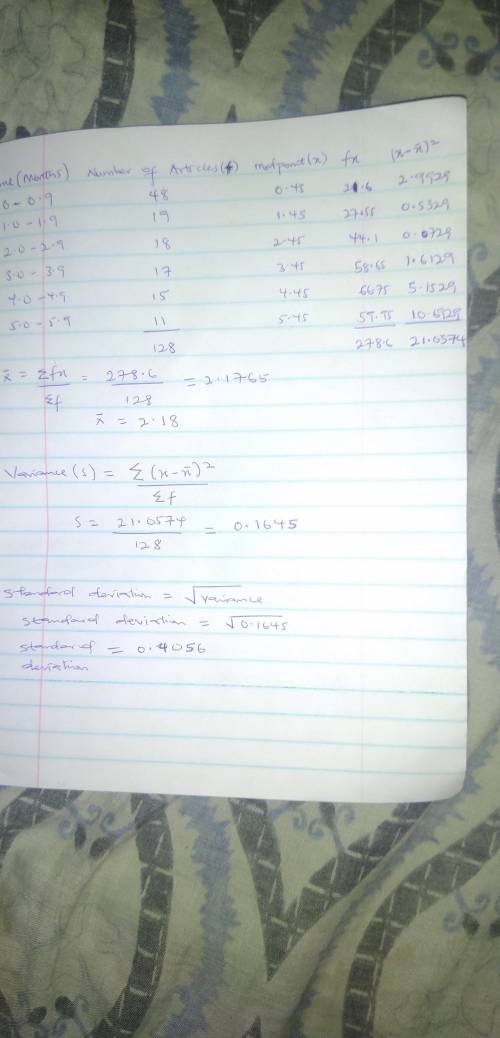
The following table presents the time taken to review articles that were submitted for publication to a particular journal during a recent year. A few articles took longer than 6 months to review; these are omitted from the table. Consider the data to be a population. (image) (a) Approximate the variance of the times. Round the answer to at least two decimal places. The variance is (b) Approximate the standard deviation of the times. Round the answer to at least two decimal places. The standard deviation is

Answers: 3


Another question on Mathematics
Mathematics, 21.06.2019 14:00
Use the knowledge of x- and y- intercepts to choose the correct graph of the equation 3x+6y=6
Answers: 1
Mathematics, 21.06.2019 22:30
Assume that y varies inversely with x. if y=1.6 when x=0.5 find x when y=3.2
Answers: 1
Mathematics, 22.06.2019 00:30
Anew test for ra is being developed. the test is administered to 750 patients with ra and 750 without ra. for the sake of the question, assume the prevalence of ra in this population is 50%. of the 750 patients with ra, 575 have a positive result. of the 750 patients without ra, 150 have a positive result. what is the positive predictive value of the new test? a575/(575+150) b. 600/(600+ 150) c. 575/(575+125) d. 600/(600+ 125)
Answers: 2
You know the right answer?
The following table presents the time taken to review articles that were submitted for publication t...
Questions


History, 21.11.2019 01:31


Spanish, 21.11.2019 01:31
Physics, 21.11.2019 01:31
Mathematics, 21.11.2019 01:31
History, 21.11.2019 01:31
Mathematics, 21.11.2019 01:31

Health, 21.11.2019 01:31
Mathematics, 21.11.2019 01:31

Geography, 21.11.2019 01:31
English, 21.11.2019 01:31

Arts, 21.11.2019 01:31


