
Mathematics, 07.09.2020 01:01 devaughnnorthcu1565
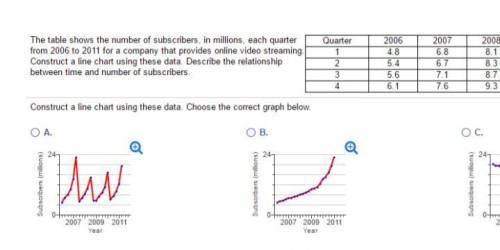
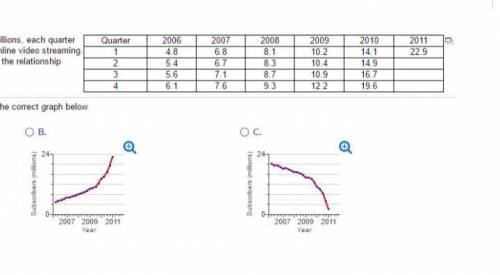
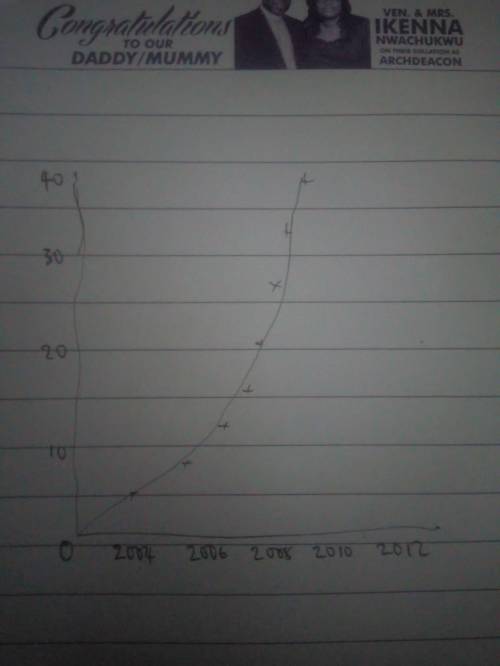
The table shows the number of world-wide subscribers, in millions, each quarter from 2012 to 2017 for a company that provides online video streaming. Construct a line chart using these data. Describe the relationship between time and number of subscribers.
Quarter 2006 2007 2008 2009 2010 2011
1 4.8 6.8 8.1 10.2 14.1 22.9
2 5.4 6.7 8.3 10.4 14.9
3 5.6 7.1 8.7 10.9 16.7
4 6.1 7.6 9.3 12.2 19.6
Required:
Construct a line chart using these data.

Answers: 1


Another question on Mathematics
Mathematics, 21.06.2019 14:00
Demonstrate the proof of your new polynomial identity through an algebraic proof and a numerical proof in an engaging way! make it so the whole world wants to purchase your polynomial identity and can't imagine living without it! you must: label and display your new polynomial identity prove that it is true through an algebraic proof, identifying each step demonstrate that your polynomial identity works on numerical relationships create your own using the columns below. see what happens when different binomials or trinomials are combined. square one factor from column a and add it to one factor from column b to develop your own identity. column a column b (x − y) (x2 + 2xy + y2) (x + y) (x2 − 2xy + y2) (y + x) (ax + b) (y − x) (cy + d)
Answers: 3
Mathematics, 21.06.2019 19:30
Combine the information in the problem and the chart using the average balance method to solve the problem.
Answers: 2
Mathematics, 21.06.2019 19:30
What are the solutions to the following equation? |m| = 8.5 the value of m is equal to 8.5 and because each distance from zero is 8.5.
Answers: 3
You know the right answer?
The table shows the number of world-wide subscribers, in millions, each quarter from 2012 to 2017 fo...
Questions


Physics, 27.12.2019 14:31

Chemistry, 27.12.2019 14:31

Biology, 27.12.2019 14:31
English, 27.12.2019 14:31

Geography, 27.12.2019 14:31

Spanish, 27.12.2019 14:31

World Languages, 27.12.2019 14:31
Mathematics, 27.12.2019 14:31


History, 27.12.2019 14:31
Mathematics, 27.12.2019 14:31
Mathematics, 27.12.2019 14:31


