
Mathematics, 30.08.2020 01:01 maddieg5585
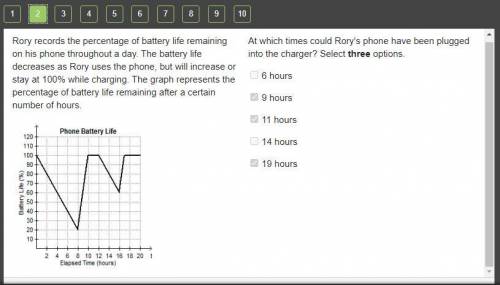
Rory records the percentage of battery life remaining on his phone throughout a day. The battery life decreases as Rory uses the phone, but will increase or stay at 100% while charging. The graph represents the percentage of battery life remaining after a certain number of hours. A graph titled Phone Battery Life. The horizontal axis shows Elapsed Time (hours) numbered 2 to 20, and the horizontal axis shows Battery Life (%) numbered 10 to 120. A line begins at 100% in 0 hours, to 20% in 8 hours, to 100% from 10 to 12 hours, to 60% in 16 hours, to 100% from 17 to 20 hours.

Answers: 1


Another question on Mathematics
Mathematics, 21.06.2019 12:30
Suppose investors can earn a return of 2% per 6 months on a treasury note with 6 months remaining until maturity. the face value of the t-bill is $10,000. what price would you expect a 6-month maturity treasury bill to sell for? (round your answer to 2 decimal places. omit the "$" sign in your response.)
Answers: 2
Mathematics, 21.06.2019 16:00
Part one: measurements 1. measure your own height and arm span (from finger-tip to finger-tip) in inches. you will likely need some from a parent, guardian, or sibling to get accurate measurements. record your measurements on the "data record" document. use the "data record" to you complete part two of this project. name relationship to student x height in inches y arm span in inches archie dad 72 72 ginelle mom 65 66 sarah sister 64 65 meleah sister 66 3/4 67 rachel sister 53 1/2 53 emily auntie 66 1/2 66 hannah myself 66 1/2 69 part two: representation of data with plots 1. using graphing software of your choice, create a scatter plot of your data. predict the line of best fit, and sketch it on your graph. part three: the line of best fit include your scatter plot and the answers to the following questions in your word processing document 1. 1. which variable did you plot on the x-axis, and which variable did you plot on the y-axis? explain why you assigned the variables in that way. 2. write the equation of the line of best fit using the slope-intercept formula $y = mx + b$. show all your work, including the points used to determine the slope and how the equation was determined. 3. what does the slope of the line represent within the context of your graph? what does the y-intercept represent? 5. use the line of best fit to you to describe the data correlation.
Answers: 2
Mathematics, 21.06.2019 22:00
Find two numbers if their sum is 91 and the ratio is 6: 7?
Answers: 1
You know the right answer?
Rory records the percentage of battery life remaining on his phone throughout a day. The battery lif...
Questions


Arts, 10.02.2020 22:51
Mathematics, 10.02.2020 22:51

History, 10.02.2020 22:51

Computers and Technology, 10.02.2020 22:51

Computers and Technology, 10.02.2020 22:51
Computers and Technology, 10.02.2020 22:51
Biology, 10.02.2020 22:51
Biology, 10.02.2020 22:51

Spanish, 10.02.2020 22:51


