
Mathematics, 27.08.2020 01:01 staciagirl3880
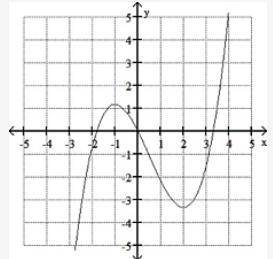
Use the graph of f to estimate the local maximum and local minimum. A cubic graph is shown increasing, then decreasing, then increasing again. The graph intercepts the x axis at approximately -1.8, 0, and 3.2. Local maximum: approx. (-1,1.17); local minimum: approx. (2,-3.33) Local maximum: (0,0); local minimum: (3.2,0) Local maximum: ∞ local minimum: -∞ No local maximum; no local minimum

Answers: 2


Another question on Mathematics
Mathematics, 21.06.2019 19:00
Acompany manufactures large valves, packed in boxes. a shipment consists of 1500 valves packed in 75 boxes. each box has the outer dimensions 1.2 x 0.8 x 1.6 m and the inner dimensions 1.19 x 0.79 x 1.59 m. the boxes are loaded on a vehicle (truck + trailer). the available capacity in the vehicle combination is 140 m3. each valve has a volume of 0.06 m3. - calculate the load factor on the box level (%). - calculate the load factor on the vehicle level (%). - calculate the overall load factor (%).
Answers: 1
Mathematics, 22.06.2019 00:20
Traffic on saturday, it took ms. torres 24 minutes to drive 20 miles from her home to her office. during friday's rush hour, it took 75 minutes to drive the same distance. a. what was ms. torres's average speed in miles per hour on saturday? b. what was her average speed in miles per hour on friday?
Answers: 1
Mathematics, 22.06.2019 01:30
Write 37/22 as a decimal rounded to the nearest hundredth.
Answers: 2
You know the right answer?
Use the graph of f to estimate the local maximum and local minimum. A cubic graph is shown increasin...
Questions

Advanced Placement (AP), 22.09.2021 01:00

Spanish, 22.09.2021 01:00

History, 22.09.2021 01:00


Mathematics, 22.09.2021 01:00
Mathematics, 22.09.2021 01:00
Mathematics, 22.09.2021 01:00

Physics, 22.09.2021 01:00
Mathematics, 22.09.2021 01:00


