
Mathematics, 25.08.2020 21:01 alee885
M 1
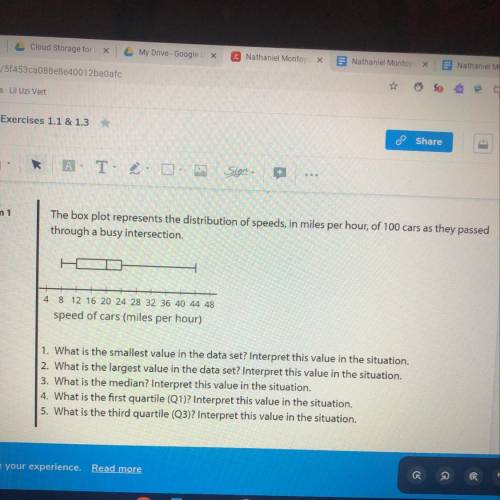
The box plot represents the distribution of speeds, in miles per hour, of 100 cars as they passed
through a busy intersection.
4
8 12 16 20 24 28 32 36 40 44 48
speed of cars (miles per hour)
1. What is the smallest value in the data set? Interpret this value in the situation.
2. What is the largest value in the data set? Interpret this value in the situation.
3. What is the median? Interpret this value in the situation.
4. What is the first quartile (Q1)? Interpret this value in the situation.
5. What is the third quartile (Q3)? Interpret this value in the situation.

Answers: 1


Another question on Mathematics
Mathematics, 20.06.2019 18:04
Writing the simplest form of a fraction means the numerator and the denominator have no common factors other than 1.a. trueb. false
Answers: 2
Mathematics, 21.06.2019 16:00
You use math in day-to-day routines when grocery shopping, going to the bank or mall, and while cooking. how do you imagine you will use math in your healthcare career?
Answers: 1
Mathematics, 21.06.2019 19:00
Asmall business produces and sells balls. the fixed costs are $20 and each ball costs $4.32 to produce. each ball sells for $8.32. write the equations for the total cost, c, and the revenue, r, then use the graphing method to determine how many balls must be sold to break even.
Answers: 3
Mathematics, 22.06.2019 00:00
(50 ) mrs. julien’s and mrs. castillejo’s classes are selling cookie dough for a school fundraiser. customers can buy packages of macadamia nut chip cookie dough and packages of triple chocolate cookie dough. mrs. julien’s class sold 25 packages of macadamia nut chip cookie dough and 30 packages of triple chocolate cookie dough for a total of $221.25. mrs. castillejo’s class sold 5 packages of macadamia nut chip cookie dough and 45 packages of triple chocolate cookie dough for a total of $191.25. (a) write the system of equations that model the problem. be sure to explain which equation represents which situation. (b) find the cost of each type of cookie. show your work. (c) explain which method you used to solve the system and why you chose that method.
Answers: 1
You know the right answer?
M 1
The box plot represents the distribution of speeds, in miles per hour, of 100 cars as they pass...
Questions

World Languages, 16.11.2020 01:00


Mathematics, 16.11.2020 01:00

Social Studies, 16.11.2020 01:00
Mathematics, 16.11.2020 01:00

Arts, 16.11.2020 01:00
Mathematics, 16.11.2020 01:00
Mathematics, 16.11.2020 01:00


