
Mathematics, 12.08.2020 07:01 leslie4759
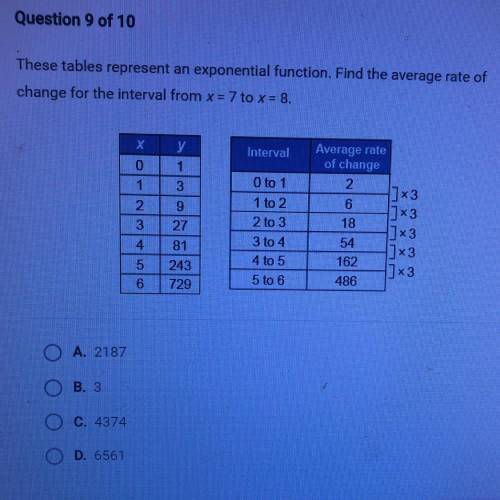
These tables represent an exponential function. Find the average rate of
change for the interval from x = 7 to x = 8.
y
Interval
1
х
0
1
2
3
4
5
6
3
9
27
81
243
729
O to 1
1 to 2
2 to 3
3 to 4
4 to 5
5 to 6
Average rate
of change
2
1]x3
6
1]x3
18
] 3
54
1] x3
162
1] x3
486
O A. 2187
O B. 3
O C. 4374
OD. 6561

Answers: 3


Another question on Mathematics
Mathematics, 21.06.2019 15:30
Data was collected on myrtle beach for 11 consecutive days. each day the temperature and number of visitors was noted. the scatter plot below represents this data. how many people visited the beach when the temperature was 84 degrees?
Answers: 1
Mathematics, 21.06.2019 17:00
Write an equation in point-slope form for the line through the given point that has the given slope (-2,-7); m=-3/2
Answers: 2
Mathematics, 21.06.2019 19:30
If the ratio of sum of the first m and n terms of an ap is m2 : n2 , show that the ratio of its mth and nth terms is (2m − 1) : (2n − 1).
Answers: 1
Mathematics, 21.06.2019 20:00
The distribution of the amount of money spent by students for textbooks in a semester is approximately normal in shape with a mean of $235 and a standard deviation of $20. according to the standard deviation rule, how much did almost all (99.7%) of the students spend on textbooks in a semester?
Answers: 2
You know the right answer?
These tables represent an exponential function. Find the average rate of
change for the interval fr...
Questions
Mathematics, 04.12.2019 00:31
Mathematics, 04.12.2019 00:31
Mathematics, 04.12.2019 00:31

Advanced Placement (AP), 04.12.2019 00:31
Mathematics, 04.12.2019 00:31


Chemistry, 04.12.2019 00:31


History, 04.12.2019 00:31
History, 04.12.2019 00:31

Biology, 04.12.2019 00:31
Mathematics, 04.12.2019 00:31


