
Mathematics, 01.08.2020 01:01 kaysayfam747
The accompanying data represent the total travel tax (in dollars) for a 3-day business trip in randomly selected cities. A normal probability plot suggests the data could come from a population that is normally distributed. A boxplot indicates there are no outliers. Complete parts (a) through (c) below
68.87 78.25 70.44 84.67 79.79 86.33 100.24 98.26
(a) Determine a point estimate for the population mean travel tax
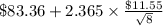
A point estimate for the population mean travel tax is $ 83.36. (Round to two decimal places as needed.)
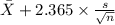
(b) Construct and interpret a 95% confidence interval for the mean tax paid for a three-day business trip.
Select the correct choice below and fill in the answer boxes to complete your choice. (Round to two decimal places as needed.)
A. The lower bound is $ and the upper bound is $. One can be % confident that all cities have a travel tax between these values.
B. The lower bound is $ and the upper bound is $ The travel tax is between these values for % of all cities.
C. The lower bound is $ and the upper bound is $ There is a % probability that the mean travel tax for all cities is between these values.
D. The lower bound is $ and the upper bound is One can be [95]% confident that the mean travel tax for all cities is between these values.
(c) What would you recommend to a researcher who wants to increase the precision of the interval, but does not have access to additional data?
A. The researcher could decrease the level of confidence.
B. The researcher could decrease the sample standard deviation.
C. The researcher could increase the level of confidence
D. The researcher could increase the sample mean

Answers: 3
 =
= 

 = $83.36
 ~
~ 
 = $11.55
 = population mean travel tax
 <
<  <
<  ) = 0.95
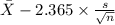 <
<  ) = 0.95
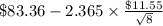 ,
,  ]
]

Another question on Mathematics
Mathematics, 22.06.2019 00:20
Three students, javier, sam, and corrine, participated in a fundraiser where people donated a certain amount of money per lap that the student ran. each student also had some initial donations that were collected before the run. the equations that represent each student's total donation, y, based on the number of laps ran, x, is shown below. match each equation with the correct rate of change for that student.
Answers: 1
Mathematics, 22.06.2019 01:30
Write the equation of the circle centered at (10,-2) with radius 2
Answers: 2
Mathematics, 22.06.2019 03:00
Which answer choice is it? is it the first ,second,third or fourth giving 40 points for whoever answers correctly you
Answers: 1
You know the right answer?
The accompanying data represent the total travel tax (in dollars) for a 3-day business trip in rando...
Questions

History, 23.07.2019 03:30

Computers and Technology, 23.07.2019 03:30
History, 23.07.2019 03:30

Social Studies, 23.07.2019 03:30

Mathematics, 23.07.2019 03:30
Mathematics, 23.07.2019 03:30

Mathematics, 23.07.2019 03:30


Business, 23.07.2019 03:30
History, 23.07.2019 03:30

Chemistry, 23.07.2019 03:30
Mathematics, 23.07.2019 03:30
History, 23.07.2019 03:30
Mathematics, 23.07.2019 03:30


