
Mathematics, 30.07.2020 01:01 rileyeddins1010
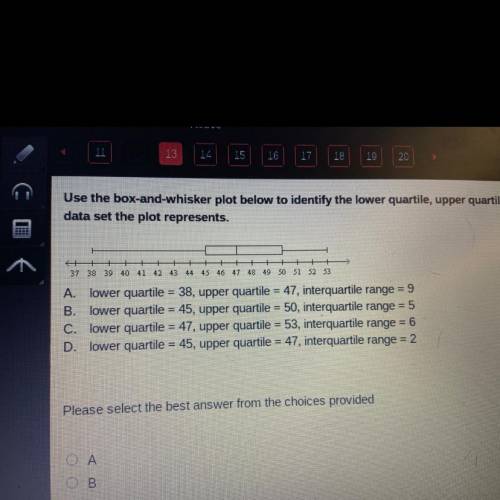
Use the box-and-whisker plot below to identify the lower quartile, upper quartile, and interquartile range of the
data set the plot represents.
37 38 39 40 41 42 43 44 45 46 47 48 49 50 51 52 53
A lower quartile - 38, upper quartile = 47. interquartile range = 9
B lower quartile = 45, upper quartile -50, interquartile range = 5
cu lower quartile 47 upper quartile = 53, interquartile range 6
D. lower quartile = 45, upper quartile = 47. interquartile range = 2

Answers: 2


Another question on Mathematics
Mathematics, 21.06.2019 13:00
What is the y-coordinate of the solution of the system of equations? [tex]y = 2x + 14 \\ - 4x - y = 4[/tex]y=
Answers: 1
Mathematics, 21.06.2019 20:50
Find the equation of a line that is perpendicular to line g that contains (p, q). coordinate plane with line g that passes through the points negative 3 comma 6 and 0 comma 5 3x − y = 3p − q 3x + y = q − 3p x − y = p − q x + y = q − p
Answers: 1
Mathematics, 21.06.2019 23:00
What adds to be the bottom number but also multiplies to be the top number with 8 on the bottom and 15 on top
Answers: 2
Mathematics, 22.06.2019 01:30
What is 0.368,0.380,0.365,and 0.383 in order from least to greatest
Answers: 1
You know the right answer?
Use the box-and-whisker plot below to identify the lower quartile, upper quartile, and interquartile...
Questions

Spanish, 05.11.2019 13:31
Mathematics, 05.11.2019 13:31

Chemistry, 05.11.2019 13:31

Mathematics, 05.11.2019 13:31
Mathematics, 05.11.2019 13:31


Biology, 05.11.2019 13:31
Mathematics, 05.11.2019 13:31
Mathematics, 05.11.2019 13:31
History, 05.11.2019 13:31


