
Mathematics, 24.07.2020 20:01 oliviaciscooc
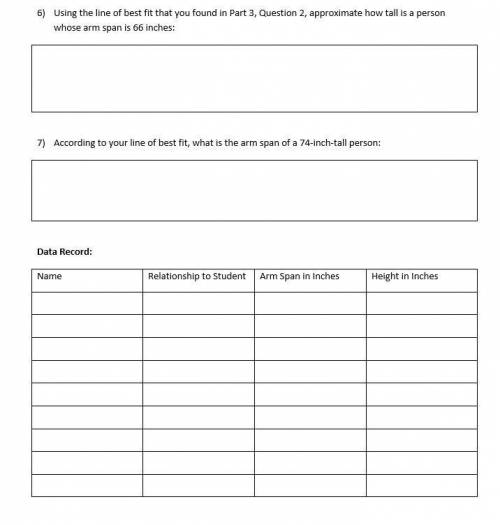
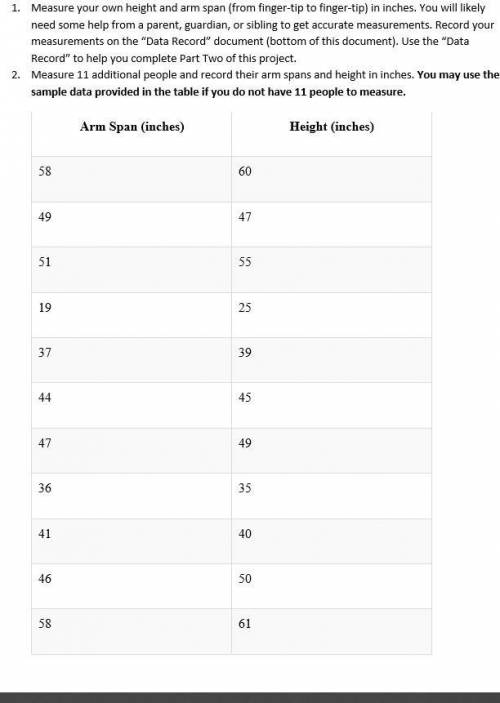
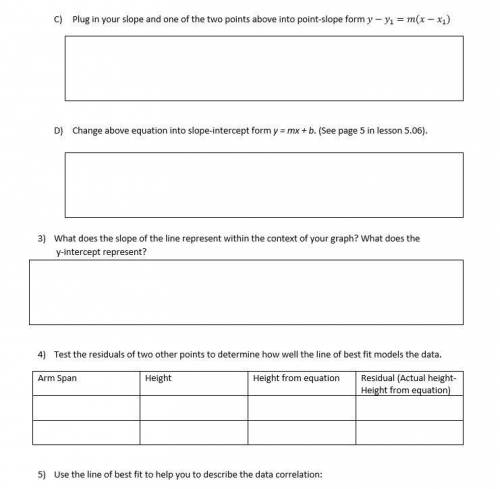
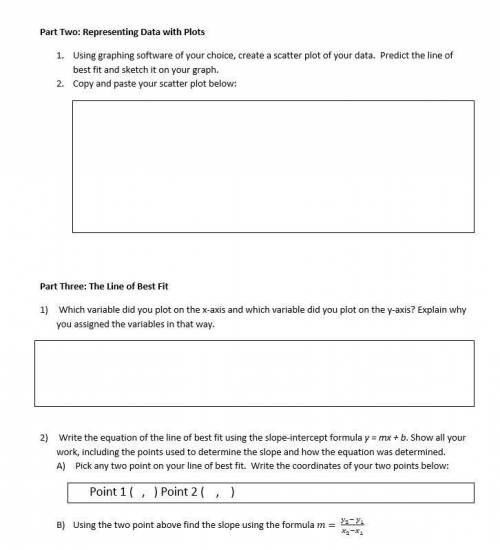
Part One: Measurements Measure your own height and arm span (from finger-tip to finger-tip) in inches. You will likely need some help from a parent, guardian, or sibling to get accurate measurements. Record your measurements on the “Data Record” document (bottom of this document). Use the “Data Record” to help you complete Part Two of this project. Measure 11 additional people and record their arm spans and height in inches. You may use the sample data provided in the table if you do not have 11 people to measure. Arm Span (inches) Height (inches) 58 60 49 47 51 55 19 25 37 39 44 45 47 49 36 35 41 40 46 50 58 61 Part Two: Representing Data with Plots Using graphing software of your choice, create a scatter plot of your data. Predict the line of best fit and sketch it on your graph. Copy and paste your scatter plot below: Part Three: The Line of Best Fit Which variable did you plot on the x-axis and which variable did you plot on the y-axis? Explain why you assigned the variables in that way. Write the equation of the line of best fit using the slope-intercept formula y = mx + b. Show all your work, including the points used to determine the slope and how the equation was determined. Pick any two point on your line of best fit. Write the coordinates of your two points below: Point 1 ( , ) Point 2 ( , ) Using the two point above find the slope using the formula m= (y_2- y_1)/(x_2-x_1 ) Plug in your slope and one of the two points above into point-slope form y-y_1=m(x-x_1) Change above equation into slope-intercept form y = mx + b. (See page 5 in lesson 5.06). What does the slope of the line represent within the context of your graph? What does the y-intercept represent? Test the residuals of two other points to determine how well the line of best fit models the data. Arm Span Height Height from equation Residual (Actual height-Height from equation) Use the line of best fit to help you to describe the data correlation: Using the line of best fit that you found in Part 3, Question 2, approximate how tall is a person whose arm span is 66 inches: According to your line of best fit, what is the arm span of a 74-inch-tall person: Data Record: Name Relationship to Student Arm Span in Inches Height in Inches

Answers: 3


Another question on Mathematics
Mathematics, 21.06.2019 12:30
Anumber cube is rolled and a coin is tossed. the number cube and the coin are fair. what is the probability that the number rolled is less than 4 and the coin toss is tails?
Answers: 2
Mathematics, 21.06.2019 17:30
Give the equations of two different lines that are perpendicular to the line 3x + 4y = 7.
Answers: 1
Mathematics, 21.06.2019 20:10
A. use the formula for continuous compounding with the original example: $1000 invested at 2% for 1 year. record the amount to 5 decimal places. use a calculator. b. compare it to the result using the original compound interest formula with n = 365 calculated to 5 decimal places. which has a larger value? explain.
Answers: 1
Mathematics, 21.06.2019 22:00
Benjamin is making bow ties. how many 1/2yards lomg bow ties can he make if he has 18 feet of fabric?
Answers: 2
You know the right answer?
Part One: Measurements Measure your own height and arm span (from finger-tip to finger-tip) in inche...
Questions

Computers and Technology, 08.11.2020 14:00
Mathematics, 08.11.2020 14:00


Physics, 08.11.2020 14:00

English, 08.11.2020 14:00
Mathematics, 08.11.2020 14:00
Physics, 08.11.2020 14:00
Computers and Technology, 08.11.2020 14:00

Mathematics, 08.11.2020 14:00
Mathematics, 08.11.2020 14:00
Mathematics, 08.11.2020 14:00
Health, 08.11.2020 14:00
Health, 08.11.2020 14:00
Physics, 08.11.2020 14:00
Computers and Technology, 08.11.2020 14:00
History, 08.11.2020 14:00
Mathematics, 08.11.2020 14:00


