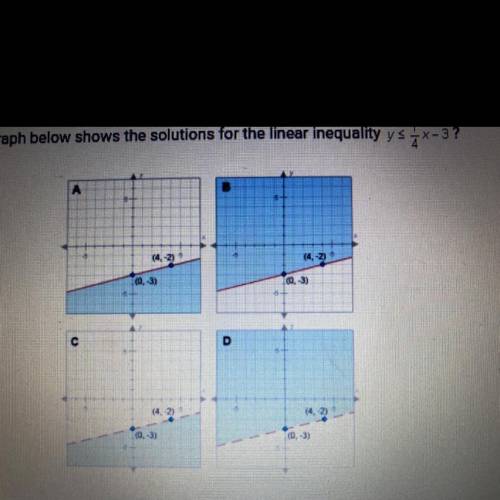
Graph A.
Step-by-step explanation:
Given the inequality:
Since the sign is "less than or equal to", the line cannot be dotted. Therefore, Options C and D are incorrect.
Since the sign is a "less than" sign, the required region must be below the line. Therefore, the graph which shows the given inequality is Graph A.
the graph on the bottom right
good job you smart son of a gun you are smarter that einstein. 7