
Mathematics, 23.07.2020 02:01 amf14
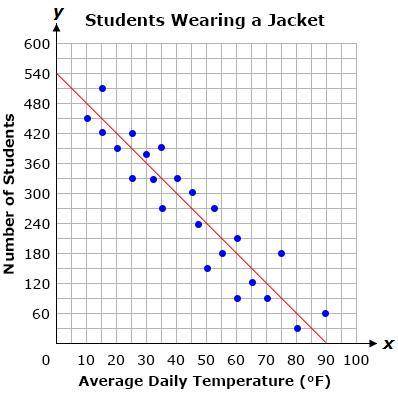
The graph below shows a line of best fit for data collected on the number of students who wear a jacket to school and the average daily temperature in degrees Fahrenheit.
Based on the line of best fit, how many students wear a jacket to school when the temperature is 50°F?
A.) 240
B.) 210
C.) 300
D.) 180

Answers: 3


Another question on Mathematics
Mathematics, 21.06.2019 19:00
D(5, 7). e(4,3), and f(8, 2) form the vertices of a triangle. what is mzdef? oa. 30° ob. 45° oc. 60° od 90°
Answers: 1
Mathematics, 21.06.2019 19:30
In need of in the diagram, ∠abc is a right angle. ∠dbc = 30°27'40". find the measure of ∠abd.
Answers: 1
Mathematics, 21.06.2019 23:00
Find the equation of the ellipse with the following properties. the ellipse with foci at (0, 6) and (0, -6); y-intercepts (0, 8) and (0, -8).edit: the answer is x^2 over 28 + y^2 over 64 = 1
Answers: 2
You know the right answer?
The graph below shows a line of best fit for data collected on the number of students who wear a jac...
Questions


Mathematics, 06.09.2020 06:01
Mathematics, 06.09.2020 06:01
Mathematics, 06.09.2020 06:01
Mathematics, 06.09.2020 06:01

Mathematics, 06.09.2020 06:01
Mathematics, 06.09.2020 06:01
Mathematics, 06.09.2020 06:01
English, 06.09.2020 06:01


