
Mathematics, 14.07.2020 01:01 jackb9361
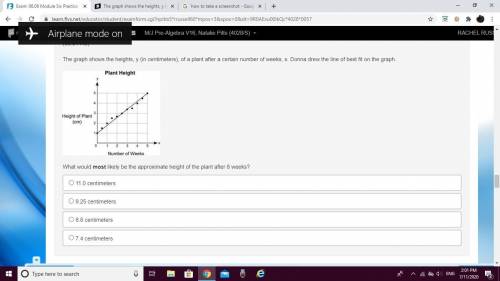
The graph shows the heights, y (in centimeters), of a plant after a certain number of weeks, x. Donna drew the line of best fit on the graph. A graph titled Plant Height shows Number of Weeks on x axis and Height of Plant in cm on y axis. The scales on both x and y axes are shown from 0 to 5 at increments of 5. The graph shows dots at the ordered pairs 0, 1 and 0.5, 1.5 and 1, 2 and 1.5, 2.5 and 2, 2.8 and 2.5, 3 and 3, 3.4 and 3.5, 3.5 and 4, 4 and 4.5,4.5 and 5, 5. A straight line joins the ordered pairs 0, 1 and 5, 5 What would most likely be the approximate height of the plant after 8 weeks? 11.0 centimeters 9.25 centimeters 8.8 centimeters 7.4 centimeters

Answers: 1


Another question on Mathematics
Mathematics, 21.06.2019 14:00
Question 1(multiple choice worth 1 points)(07.06 mc)a group of students must collect at least $150 to organize a science fair. they have already collected $30. which graph best represents all remaining amounts of money, in dollars, that thestudents should still collect to organize the science fair? -210 -180 -150 - 120 -90-60 -300306090 120 150 180 210-210 -180 -150 - 120 -90 -60 -30 0 30 60 90 120 150 180 210-210 -180-150 - 120 -90-60-300 30 60 90 120 150 180 210-210 -180 -150 - 120.90 -60 -30 0 30 60 90 120 150 180 210
Answers: 3
Mathematics, 21.06.2019 20:30
If you are dealt 4 cards from a shuffled deck of 52? cards, find the probability that all 4 cards are diamondsdiamonds.
Answers: 1
Mathematics, 21.06.2019 20:30
When you have 25 numbers, and jake picks 3 random numbers and puts them back, what is the chance bob has of picking those 3 numbers when he picks 6 random numbers (without putting them back)? explain.
Answers: 1
Mathematics, 21.06.2019 22:40
Which of the following functions corresponds to the above sinusoid? a. 10 cos πx - 5 b. -5 sin x - 5 c. -10 cos πx/2 - 0.5 d. 10 sin πx - 5
Answers: 1
You know the right answer?
The graph shows the heights, y (in centimeters), of a plant after a certain number of weeks, x. Donn...
Questions
Mathematics, 12.10.2020 20:01

Biology, 12.10.2020 20:01
Mathematics, 12.10.2020 20:01


English, 12.10.2020 20:01
Mathematics, 12.10.2020 20:01

Geography, 12.10.2020 20:01
Mathematics, 12.10.2020 20:01
Mathematics, 12.10.2020 20:01
Mathematics, 12.10.2020 20:01

Chemistry, 12.10.2020 20:01
Biology, 12.10.2020 20:01
Mathematics, 12.10.2020 20:01
Mathematics, 12.10.2020 20:01


