Mathematics, 14.07.2020 01:01 willwhitlock803
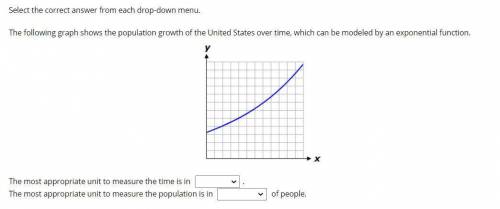
The following graph shows the population growth of the United States over time, which can be modeled by an exponential function.
(inserted image)
The most appropriate unit to measure the time is in (blank)
*drop-down menu*
1. weeks
2. Decades
3. Centuries
4. Days
The most appropriate unit to measure the population is in (blank) of people. *drop-down menu*
1. Millions
2. Hundreds
3. Thousands
4. Billions


Answers: 2


Another question on Mathematics


Mathematics, 21.06.2019 21:30
Find the domain and range of the following function f(x) = 51x - 21+ 4
Answers: 2

Mathematics, 21.06.2019 22:30
If you prove that ∆wxz is congruent to ∆yzx, which general statement best describes what you have proved?
Answers: 3

Mathematics, 22.06.2019 03:30
3a + 5b - 7 = 0 a - 2b - 4 = 0 solve the system by the elimination method. check your work {(96/11, -5/11)} {(34/11, -5/11)} {(32/33, 5/11)}
Answers: 1
You know the right answer?
The following graph shows the population growth of the United States over time, which can be modeled...
Questions


Mathematics, 12.03.2021 05:10


Mathematics, 12.03.2021 05:10

Mathematics, 12.03.2021 05:10


Social Studies, 12.03.2021 05:10


Chemistry, 12.03.2021 05:10


Mathematics, 12.03.2021 05:10


