
Mathematics, 15.07.2020 01:01 wmaingrette1
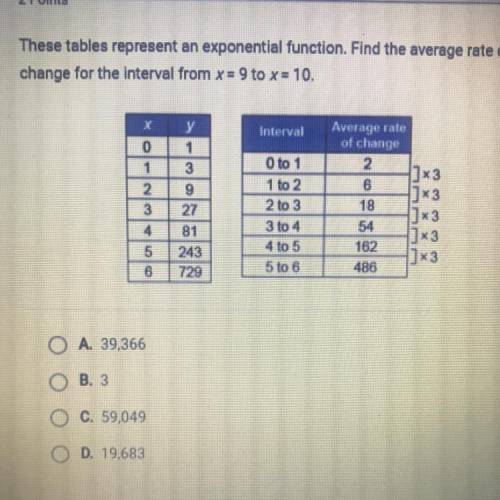
These tables represent an exponential function. Find the average rate of
change for the interval from x = 9 to x = 10.
Interval
0
1
y
1
3
9
27
2
Average rate
of change
2
1]x3
6
4] x3
18
|] 3
54
1]×3
162
1]x3
486
O to 1
1 to 2
2 to 3
3 to 4
4 to 5
5 to 6
3
4
5
6
81
243
729

Answers: 3


Another question on Mathematics
Mathematics, 21.06.2019 20:00
Someone answer asap for ! the total ticket sales for a high school basketball game were $2,260. the ticket price for students were $2.25 less than the adult ticket price. the number of adult tickets sold was 230, and the number of student tickets sold was 180. what was the price of an adult ticket?
Answers: 1
Mathematics, 22.06.2019 01:30
This graph shows a portion of an odd function. use the graph to complete the table of values. x f(x) −2 −3 −4 −6 im sorry i cant get the graph up
Answers: 1
Mathematics, 22.06.2019 01:50
Our star pitcher, foster enlight, can throw a pitch so fast that it gets to the catcher’s mitt before it leaves foster’s fingers! if the team wins a game then the probability that foster was pitching is 0.8 but only if foster had at least one day’s rest since his last pitching assignment. if foster does not have a day off and the team still wins, the probability that foster was pitching drops by half of what it was on the previous day. if the team wins three games in succession from the toronto tachyons and foster pitched in game #2, what is the probability that he pitched in one or more of the other games? (assume that foster did not pitch on the day before the first game of this three game series.)
Answers: 1
You know the right answer?
These tables represent an exponential function. Find the average rate of
change for the interval fr...
Questions

Computers and Technology, 22.08.2019 21:10
Computers and Technology, 22.08.2019 21:10


Mathematics, 22.08.2019 21:20


