
Mathematics, 07.07.2020 21:01 cvvalle15
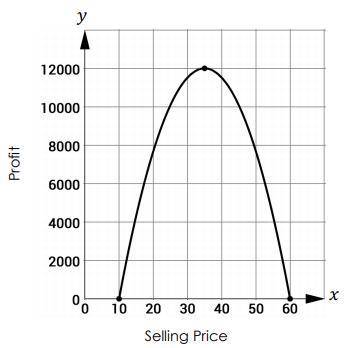
Anthony owns a sporting goods store. During his first year in the business, he collected data on different prices that yielded different profits for baseball gloves. He used the data to create the following graph showing the relationship between the selling price of an item and the profit he earned for its sale. List the key parts of this graph, and explain what each part means in a real-world context.

Answers: 3


Another question on Mathematics
Mathematics, 21.06.2019 14:40
What is the approximate circumference of the circle shown below?
Answers: 1
Mathematics, 21.06.2019 16:00
This race was first held in 1953 on august 16th. every decade the race finishes with a festival. how many years is this?
Answers: 2
Mathematics, 21.06.2019 18:00
In the xy-plane, if the parabola with equation passes through the point (-1, -1), which of the following must be true?
Answers: 3
You know the right answer?
Anthony owns a sporting goods store. During his first year in the business, he collected data on dif...
Questions

Biology, 29.10.2020 09:30

Mathematics, 29.10.2020 09:30
Mathematics, 29.10.2020 09:30

Chemistry, 29.10.2020 09:40

Social Studies, 29.10.2020 09:40
Mathematics, 29.10.2020 09:40
Mathematics, 29.10.2020 09:40

History, 29.10.2020 09:40
Arts, 29.10.2020 09:40


