
Mathematics, 05.07.2020 17:01 10040816
Stat 3309 - Statistical Analysis for Business Applications I
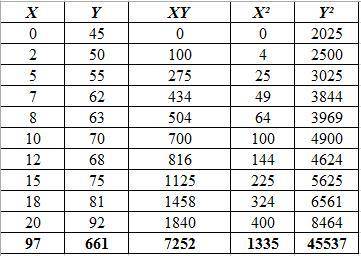
Consider the following data representing the starting salary (in $1,000) at some company and years of prior working experience in the same ï¬eld. The sample of 10 employees was taken and the following data is reported.
Years of experience
Starting Salary (in $1,000)
0
45
250
555
762
863
1070
1268
1575
1881
2092
Part 1: Use the formulas provided on the 3rd formula sheet to compute the following quantities. Open an Excel spreadsheet and write the table with data given above. Add columns for x2, y2, and xy, as well as the last row for Σ. For each of the following quantities, write the formula for it in a cell and evaluate it.
(a) Find the sample correlation coeï¬cient r.
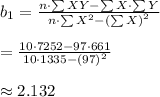
(b) Find the slope b1 of the sample regression line.
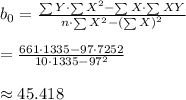
(c) Find the y-intercept b0 of the sample regression line.
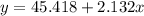
(d) What is the equation of the sample regression line?
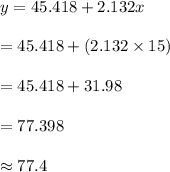
(e) Find the predicted starting salary for a person who spent 15 years working in the same ï¬eld.
(f) Find the observed starting salary for a person who spent 15 years working in the same ï¬eld.
(g) What is the diï¬erence between the observed and the predicted starting salary for a person who spent 15 years working in the same ï¬eld?
(h) Find the total sum of squares SST.
(i) Find the sum of squares error SSE.
(j) Find the sum of squares regression SSR.
(k) Use the answers from (h)-(j) to conï¬rm that SST = SSR + SSE. (l) Find the coeï¬cient of determination R2.
(m) Use your answers for (a), (b) and (l), to conï¬rm that r = ±âR2.
(n) What proportion of variation is explained using the regression model?
(o) Find the standard error of the estimate se.
(p) Find the standard error of the regression slope sb.
(q) Does the number of years of prior working experience in the same ï¬eld aï¬ect the starting salary at this company ? Use the sample provided above and the signiï¬cance level of 0.05.
(hint: perform the hypothesis test for H0 : β1 = 0 vs. H1 : β1 6= 0.)
Part 2: Find and use Excel built-in-functions to check your answers for r, b1, and b0. Next to each cell from Part 1, calculate these three quantities using Excel built-in-functions and conï¬rm your answers from Part 1.
(hint: for example, for r the Excel built-in function is "CORREL")
Part 3: Bellow your answers from Parts 1 and 2, perform the regression analysis using Excel built-in-module which can be found under "DATA" â "Data Analysis" â "Regression" and double check your answers from Part 1. Draw the scatter plot of the data and, by visually observing the graph, determine if there is a linear relationship between the number of years of prior working experience in the same ï¬eld and the starting salary at this company.

Answers: 3
![r=~\frac{n\cdot\sum{XY} - \sum{X}\cdot\sum{Y}} {\sqrt{\left[n \sum{X^2}-\left(\sum{X}\right)^2\right] \cdot \left[n \sum{Y^2}-\left(\sum{Y}\right)^2\right]}} \\](/tpl/images/0701/8269/6bbef.png)
![\begin{aligned}r~&=~\frac{n\cdot\sum{XY} - \sum{X}\cdot\sum{Y}} {\sqrt{\left[n \sum{X^2}-\left(\sum{X}\right)^2\right] \cdot \left[n \sum{Y^2}-\left(\sum{Y}\right)^2\right]}} \\r~&=~\frac{ 10 \cdot 7252 - 97 \cdot 661 } {\sqrt{\left[ 10 \cdot 1335 - 97^2 \right] \cdot \left[ 10 \cdot 45537 - 661^2 \right] }} \approx 0.9855\end{aligned}](/tpl/images/0701/8269/a5b20.png)


Another question on Mathematics
Mathematics, 21.06.2019 16:30
For how answer my question this will be the last question can you answer in math subject
Answers: 2
Mathematics, 21.06.2019 18:00
What is the value of x in the equation 2(x-4) = 4(2x + 1)?
Answers: 1
Mathematics, 21.06.2019 21:30
Aroulette wheel has 38 slots in which the ball can land. two of the slots are green, 18 are red, and 18 are black. the ball is equally likely to land in any slot. the roulette wheel is going to be spun twice, and the outcomes of the two spins are independent.the probability that it lands one time on red and another time on black in any order is(a) 0.5 (b) 0.25 (c) 0.4488 (d) 0.2244
Answers: 1
You know the right answer?
Stat 3309 - Statistical Analysis for Business Applications I
Consider the following data representi...
Questions
Mathematics, 27.12.2020 21:20


Physics, 27.12.2020 21:20
Mathematics, 27.12.2020 21:20

Geography, 27.12.2020 21:20

Biology, 27.12.2020 21:30

History, 27.12.2020 21:30
English, 27.12.2020 21:30
Mathematics, 27.12.2020 21:30

Chemistry, 27.12.2020 21:30
Biology, 27.12.2020 21:30


