
Mathematics, 02.07.2020 09:01 crosales102
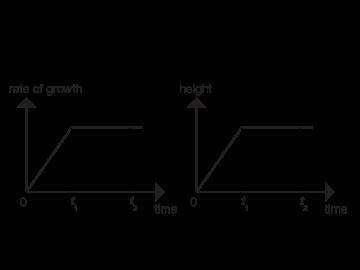
The graph for Bean Plant A shows its rate of growth as a function of time. The graph for Bean Plant B shows its height as a function of time. Use the drop-down menus to complete the statements below about the two bean plants. From time 0 to t1, Bean Plant A is growing at a rate that is _ , and Bean Plant B is growing at a rate that is _. . From time t1 to t2, Bean Plant A is growing at a rate that is _ , and Bean Plant B is growing at a rate that is _. .

Answers: 1


Another question on Mathematics
Mathematics, 21.06.2019 15:00
Adifferent website gives the cost for the first train as £56.88 and the second train as £20.11 with a £9.50 charge for cycle storage for the whole trip. how much would the journey cost you?
Answers: 2
Mathematics, 21.06.2019 21:00
Solve this problem! extra ! 3025/5.5 = a/90.75 / = fraction
Answers: 3
Mathematics, 21.06.2019 23:30
In a right triangle δabc, the length of leg ac = 5 ft and the hypotenuse ab = 13 ft. find: b the length of the angle bisector of angle ∠a.
Answers: 1
You know the right answer?
The graph for Bean Plant A shows its rate of growth as a function of time. The graph for Bean Plant...
Questions
Mathematics, 13.10.2020 14:01

Health, 13.10.2020 14:01

Geography, 13.10.2020 14:01
Mathematics, 13.10.2020 14:01

English, 13.10.2020 14:01

History, 13.10.2020 14:01


Biology, 13.10.2020 14:01
Mathematics, 13.10.2020 14:01


French, 13.10.2020 14:01
Mathematics, 13.10.2020 14:01


